Frequently Asked Questions (FAQ)#
Last updated: 2024-05-12 09:35:38
datetime#
Get current time (ISO)#
Example#
import datetime
x = datetime.datetime.now().isoformat().replace('T', ' ').split('.')[0]
x
'2024-05-12 09:35:39'
matplotlib#
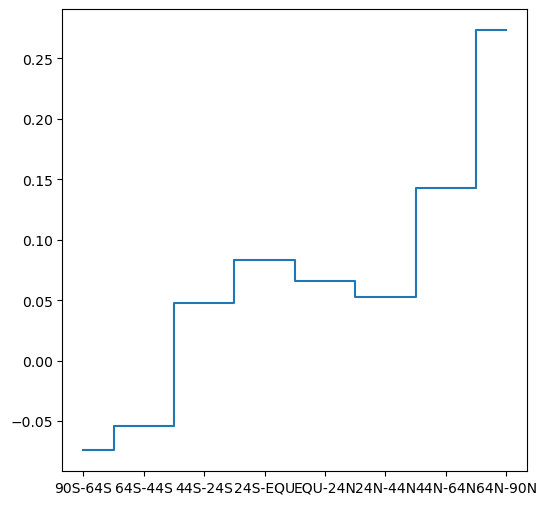
Create ‘steps’ plot#
Sample data#
import pandas as pd
dat = pd.read_csv('data/ZonAnn.Ts+dSST.csv')
cols = [
    '90S-64S',
    '64S-44S',
    '44S-24S',
    '24S-EQU',
    'EQU-24N',
    '24N-44N',
    '44N-64N',
    '64N-90N'
]
regions = dat[cols]
regions = regions.mean()
regions
90S-64S   -0.074028
64S-44S   -0.053681
44S-24S    0.047917
24S-EQU    0.083056
EQU-24N    0.066181
24N-44N    0.052500
44N-64N    0.142500
64N-90N    0.273333
dtype: float64
Example#
import matplotlib.pyplot as plt
plt.step(regions.index.to_list(), regions.to_numpy(), where='mid');
pandas#
Append to CSV if exists#
Sample data#
import pandas as pd
dat = pd.read_csv('output/stations.csv')
dat
| name | city | lines | piano | lon | lat | |
|---|---|---|---|---|---|---|
| 0 | Beer-Sheva Center | Beer-Sheva | 4 | False | 34.798443 | 31.243288 |
| 1 | Beer-Sheva University | Beer-Sheva | 5 | True | 34.812831 | 31.260284 |
| 2 | Dimona | Dimona | 1 | False | 35.011635 | 31.068616 |
Example#
# Delete output file if exists
import pandas as pd
import os
path_out = 'output/pandas_append_example.csv'
if os.path.exists(path_out):
    os.remove(path_out)
# Write
for i in range(3):
    if not os.path.exists(path_out):
        dat.to_csv(path_out, index=False)
    else:
        dat.to_csv(path_out, mode='a', header=False, index=False)
# Print output file contents
pd.read_csv(path_out)
| name | city | lines | piano | lon | lat | |
|---|---|---|---|---|---|---|
| 0 | Beer-Sheva Center | Beer-Sheva | 4 | False | 34.798443 | 31.243288 |
| 1 | Beer-Sheva University | Beer-Sheva | 5 | True | 34.812831 | 31.260284 |
| 2 | Dimona | Dimona | 1 | False | 35.011635 | 31.068616 |
| 3 | Beer-Sheva Center | Beer-Sheva | 4 | False | 34.798443 | 31.243288 |
| 4 | Beer-Sheva University | Beer-Sheva | 5 | True | 34.812831 | 31.260284 |
| 5 | Dimona | Dimona | 1 | False | 35.011635 | 31.068616 |
| 6 | Beer-Sheva Center | Beer-Sheva | 4 | False | 34.798443 | 31.243288 |
| 7 | Beer-Sheva University | Beer-Sheva | 5 | True | 34.812831 | 31.260284 |
| 8 | Dimona | Dimona | 1 | False | 35.011635 | 31.068616 |
# Delete output file
if os.path.exists(path_out):
    os.remove(path_out)
Split DataFrame to parts#
Sample data#
import pandas as pd
dat = pd.read_csv('output/stations.csv')
dat
| name | city | lines | piano | lon | lat | |
|---|---|---|---|---|---|---|
| 0 | Beer-Sheva Center | Beer-Sheva | 4 | False | 34.798443 | 31.243288 |
| 1 | Beer-Sheva University | Beer-Sheva | 5 | True | 34.812831 | 31.260284 |
| 2 | Dimona | Dimona | 1 | False | 35.011635 | 31.068616 |
Function definition#
import math
def split_dataframe(df, chunk_size = 1_000_000):
    chunks = list()
    num_chunks = math.ceil(len(df) / chunk_size)
    for i in range(num_chunks):
        chunks.append(df[i*chunk_size:(i+1)*chunk_size])
    return chunks
Example#
split_dataframe(dat, 2)
[                    name        city  lines  piano        lon        lat
 0      Beer-Sheva Center  Beer-Sheva      4  False  34.798443  31.243288
 1  Beer-Sheva University  Beer-Sheva      5   True  34.812831  31.260284,
      name    city  lines  piano        lon        lat
 2  Dimona  Dimona      1  False  35.011635  31.068616]
References:
Shift column(s) to beginning#
Sample data#
import pandas as pd
dat = pd.read_csv('output/stations.csv')
dat
| name | city | lines | piano | lon | lat | |
|---|---|---|---|---|---|---|
| 0 | Beer-Sheva Center | Beer-Sheva | 4 | False | 34.798443 | 31.243288 |
| 1 | Beer-Sheva University | Beer-Sheva | 5 | True | 34.812831 | 31.260284 |
| 2 | Dimona | Dimona | 1 | False | 35.011635 | 31.068616 |
Example#
cols = ['lon', 'lat']
dat = dat[cols  + [col for col in dat.columns if col not in cols]]
dat
| lon | lat | name | city | lines | piano | |
|---|---|---|---|---|---|---|
| 0 | 34.798443 | 31.243288 | Beer-Sheva Center | Beer-Sheva | 4 | False |
| 1 | 34.812831 | 31.260284 | Beer-Sheva University | Beer-Sheva | 5 | True |
| 2 | 35.011635 | 31.068616 | Dimona | Dimona | 1 | False |
References:
Combine CSV files#
Question#
How can we combine multiple CSV files (with same columns) into one long table?
Sample data#
import pandas as pd
dat = pd.read_csv('output/stations.csv')
dat.to_csv('output/stations_table_1.csv', index=False)
dat.to_csv('output/stations_table_2.csv', index=False)
dat.to_csv('output/stations_table_3.csv', index=False)
Example#
import pandas
import glob
files = glob.glob('output/stations_table_*.csv')
dat = []
for i in files:
    tmp = pd.read_csv(i)
    dat.append(tmp)
dat = pd.concat(dat)
dat
| name | city | lines | piano | lon | lat | |
|---|---|---|---|---|---|---|
| 0 | Beer-Sheva Center | Beer-Sheva | 4 | False | 34.798443 | 31.243288 |
| 1 | Beer-Sheva University | Beer-Sheva | 5 | True | 34.812831 | 31.260284 |
| 2 | Dimona | Dimona | 1 | False | 35.011635 | 31.068616 |
| 0 | Beer-Sheva Center | Beer-Sheva | 4 | False | 34.798443 | 31.243288 |
| 1 | Beer-Sheva University | Beer-Sheva | 5 | True | 34.812831 | 31.260284 |
| 2 | Dimona | Dimona | 1 | False | 35.011635 | 31.068616 |
| 0 | Beer-Sheva Center | Beer-Sheva | 4 | False | 34.798443 | 31.243288 |
| 1 | Beer-Sheva University | Beer-Sheva | 5 | True | 34.812831 | 31.260284 |
| 2 | Dimona | Dimona | 1 | False | 35.011635 | 31.068616 |
# Delete sample data
import os
for i in files:
    os.remove(i)
geopandas#
Calculating distances in WGS84#
Question#
How can we calculate distances over large regions given lon/lat points?
Sample data#
Two (lon,lat) points:
pnt1 = (0, 0)
pnt2 = (1, 0)
True distance according to Wikipedia:
dist = 111320
Using the Harvesine formula (less accurate)#
See Example: distance function:
import math
def distance(origin, destination):
    lon1, lat1 = origin
    lon2, lat2 = destination
    radius = 6371000
    dlat = math.radians(lat2 - lat1)
    dlon = math.radians(lon2 - lon1)
    a = (math.sin(dlat / 2) * math.sin(dlat / 2) +
         math.cos(math.radians(lat1)) * math.cos(math.radians(lat2)) *
         math.sin(dlon / 2) * math.sin(dlon / 2))
    c = 2 * math.atan2(math.sqrt(a), math.sqrt(1 - a))
    d = radius * c
    return d
result = distance(pnt1, pnt2)
result = round(result)
result
111195
dist-result ## Error of 125 meters
125
Using geodesic distance function from geopy (most accurate)#
See geopy documentation:
import geopy.distance
result = geopy.distance.distance(tuple(reversed(pnt1)), tuple(reversed(pnt2))).meters
result = round(result)
result
111319
dist - result ## Error of 1 meter
1
Beyond distance: The S2 Geometry Library#
The S2 Geometry Library by Google can be used for more complicated calculations in WGS84, such as polygon area. It has a Python interface called s2sphere.
rasterio#
Splitting a raster#
Question#
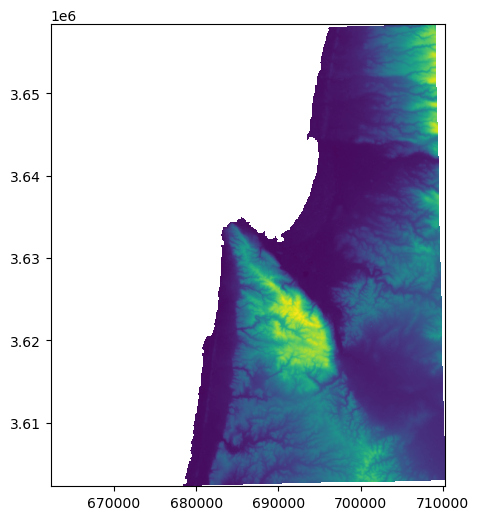
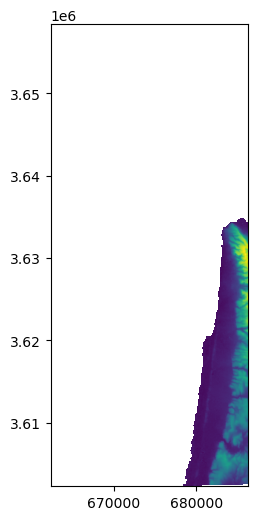
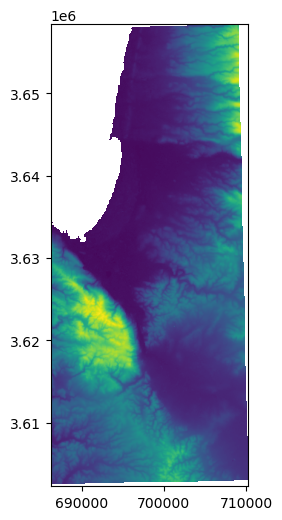
How can we split a raster into two equal halves, such as east-west or north-south?
Sample data#
import numpy as np
import rasterio
import rasterio.plot
src = rasterio.open('output/carmel2.tif')
rasterio.plot.show(src);
Example#
# Column where we split to east-west
x = round(src.shape[1] / 2)
x
266
# Western part
w1 = rasterio.windows.Window(0, 0, x, src.shape[0])
r1 = src.read(1, window=w1)
w1_transform = src.window_transform(w1)
rasterio.plot.show(r1, transform=w1_transform);
# Eastern part
w2 = rasterio.windows.Window(x, 0, src.shape[1]-x, src.shape[0])
r2 = src.read(1, window=w2)
w2_transform = src.window_transform(w2)
rasterio.plot.show(r2, transform=w2_transform);
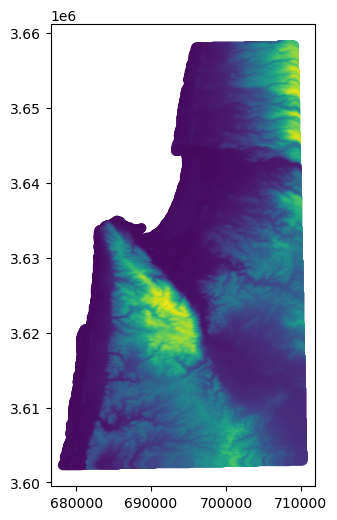
Raster to points#
Question#
How can we efficiently create a point layer from a raster?
Sample data#
import rasterio
import rasterio.plot
src = rasterio.open('output/carmel2.tif')
rasterio.plot.show(src);

Example#
import numpy as np
import pandas as pd
import geopandas as gpd
import rasterio
import rasterio.plot

src = rasterio.open('output/carmel2.tif')
height = src.shape[0]
width = src.shape[1]
cols, rows = np.meshgrid(np.arange(width), np.arange(height))
x, y = rasterio.transform.xy(src.transform, rows, cols)
x = np.array(x).flatten()
y = np.array(y).flatten()
z = src.read(1).flatten()
geom = gpd.points_from_xy(x, y, crs=src.crs)
dat = gpd.GeoDataFrame(data={'value':z}, geometry=geom)
dat
| value | geometry | |
|---|---|---|
| 0 | NaN | POINT (662362 3658367) |
| 1 | NaN | POINT (662452 3658367) |
| 2 | NaN | POINT (662542 3658367) |
| 3 | NaN | POINT (662632 3658367) |
| 4 | NaN | POINT (662722 3658367) |
| ... | ... | ... |
| 332587 | NaN | POINT (709882 3602297) |
| 332588 | NaN | POINT (709972 3602297) |
| 332589 | NaN | POINT (710062 3602297) |
| 332590 | NaN | POINT (710152 3602297) |
| 332591 | NaN | POINT (710242 3602297) |
332592 rows × 2 columns
dat.plot(column='value');
arcpy#
Listing all layers on current map#
import arcpy
aprx = arcpy.mp.ArcGISProject("CURRENT")
map = aprx.listMaps()[0]
layers = map.listLayers()
print([i.dataSource for i in layers])
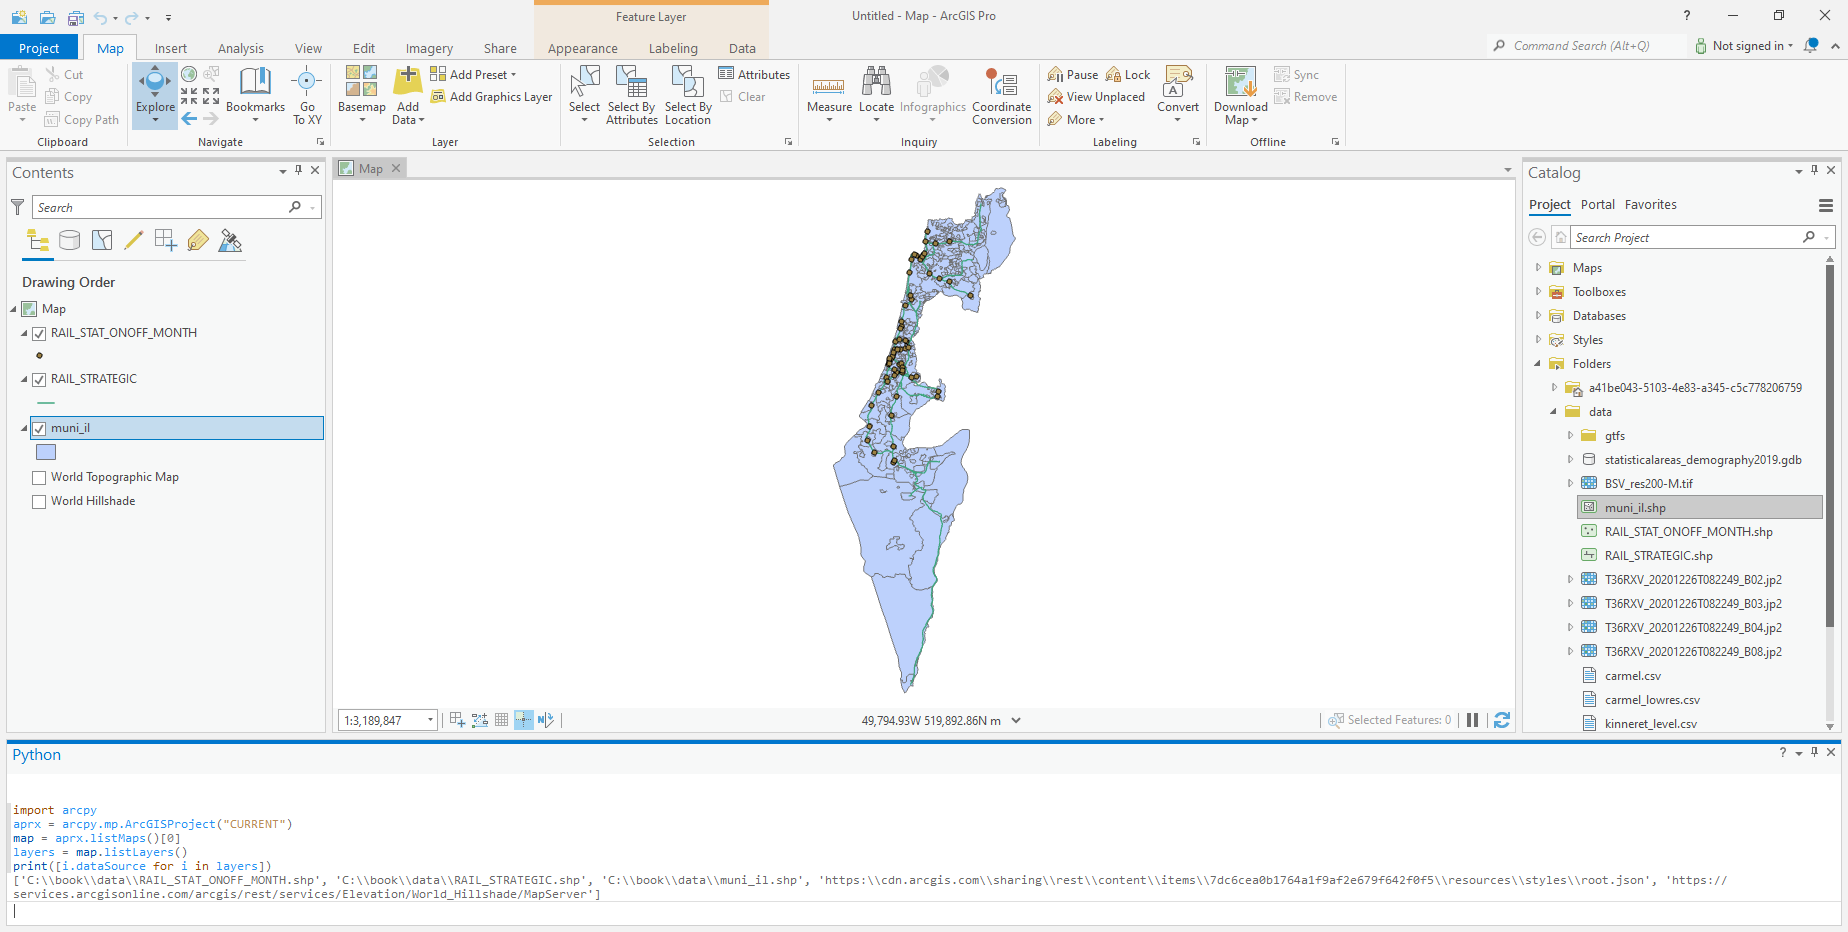
Fig. 82 Listing layers on current map with arcpy#
Transforming ecw to tif#
arcpy.env.workspace = r"\\VBOXSVR\Downloads\ortho_2015"
files = arcpy.ListFiles("*.ecw")
for i in files:
    arcpy.management.CopyRaster(i, i.replace(".ecw", ".tif"), '', None, "256", "NONE", "NONE", '', "NONE", "NONE", "TIFF", "NONE", "CURRENT_SLICE", "NO_TRANSPOSE")