D Exercise 02
Last updated: 2022-02-21 17:13:53
D.1 Question 1
- Read the
rainfall.csvfile into adata.frameobject. - Calculate and print a vector with the station names where at least one of the months has >205 mm of rainfall.
## [1] "Kfar Mahol" "Meron" "Horashim"- You can define and use the vector
mwith month names in your code, to subset the columns with monthly rainfall amounts, as shown in Section 4.4.3:
m = c("sep","oct","nov","dec","jan","feb","mar","apr","may")(50 points)
D.2 Question 2
- Create the
valueandtimevectors representing the Kinneret water level time series in November and May during 1991-2011, using the expressions from Section 3.1.3. - Plot the water level in November (month
"11") as function of water level in May (month"05"), between 1991 and 2011, where each point represents one year. The points need to be are connected in chronological order. - Add text labels marking the water levels in 1991 and 2011.
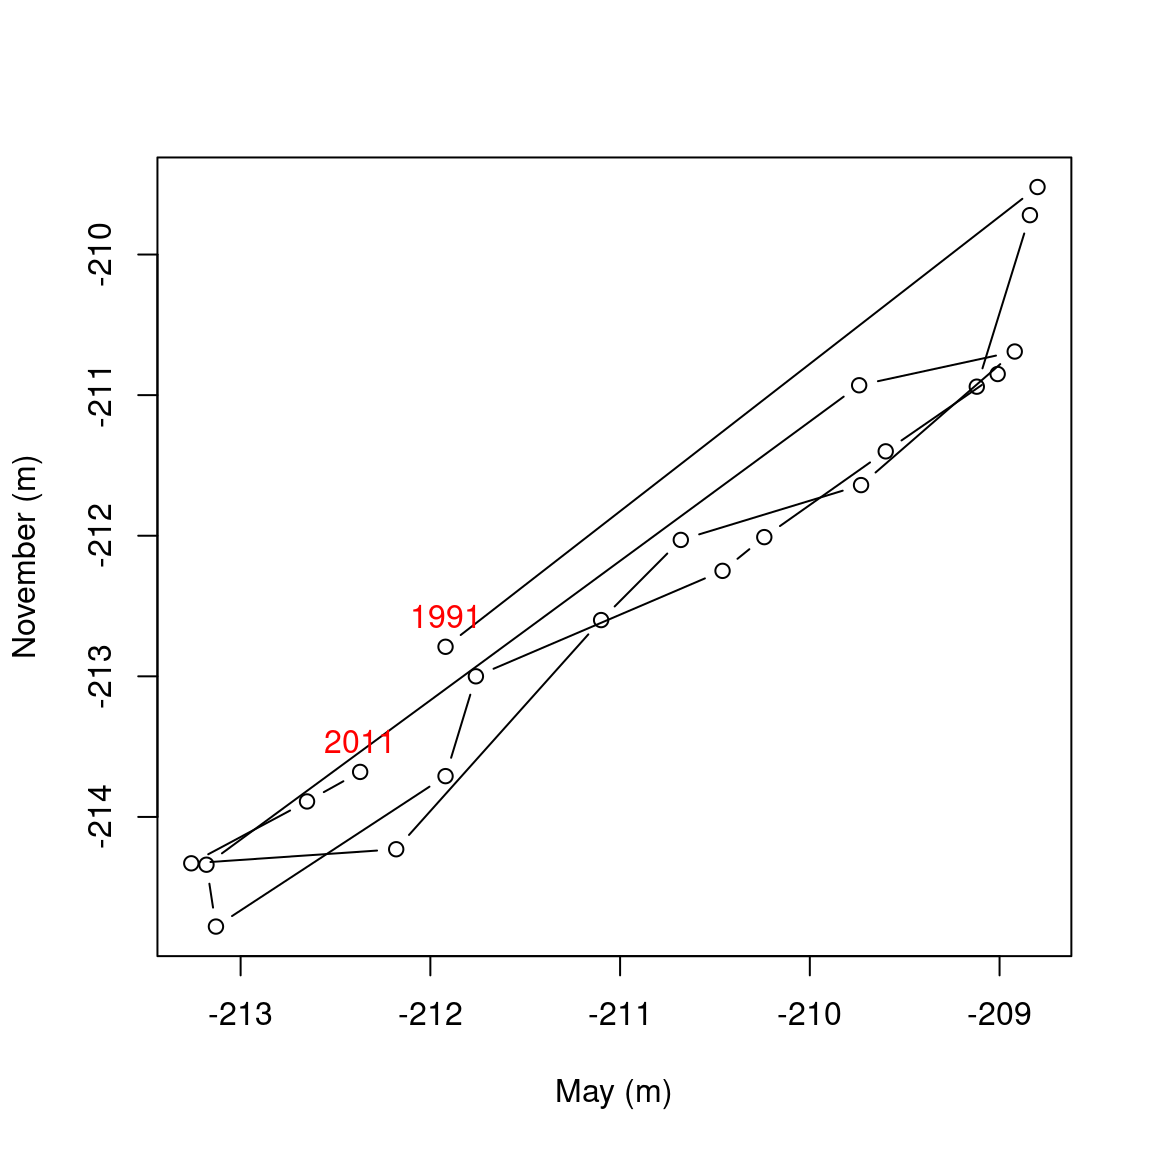
Figure D.1: Water level of lake Kinneret in May and November over time
(50 points)