H Setting up a static server using R
Last updated: 2020-06-24 13:45:23
H.1 Introduction
This tutorial shows how to set up and start a static server using R. Installing and using R can be simpler and more straightforward compared to Python (Section 5.6.2).
The steps we will go through are as follows:
H.2 Installing R
To use R we first need to install it. R can be downloaded from the R-project website. The current version is 4.0.0. Once R is installed, we can open the default interface (RGui) with Start → All Programs → R → R x64 4.0.0 (Figure H.1).
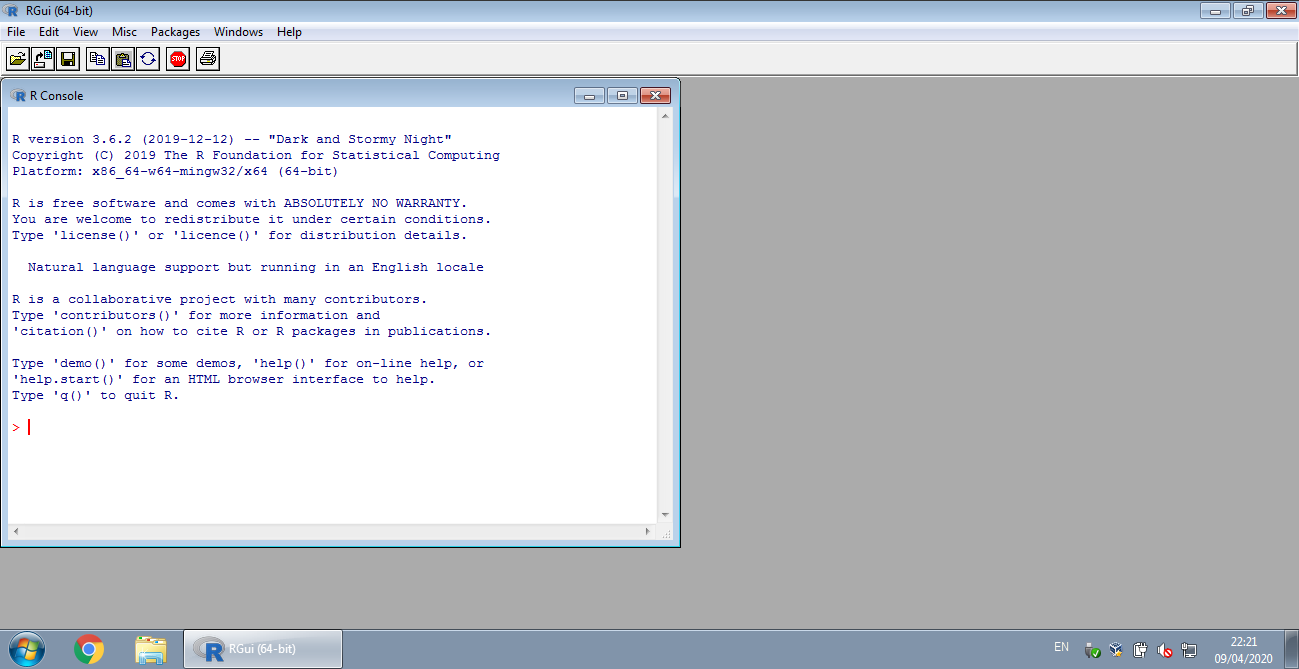
FIGURE H.1: RGui
A more advanced interface than the default one, called the RStudio, is often used when working with R. RStudio can be downloaded from the RStudio company website. The current version is 1.2.5033. Since starting a server is takes just few lines of code, RGui is is perfectly sufficient to keep things simple, and installing RStudio is not necessary.
H.3 Installing the servr package
The “R console” panel in RGui is use to type R code and execute it, much like the JavaScript console (Section 3.4). The first thing we need to do is install the servr package, which includes the static server function. Type the following expression into the R Console and press Enter:
This is a one-time operation per computer (unless you need to update the package with a newer version).
H.4 Starting the server
To use the servr package, you need to load it into the R session:
This needs to be done every time you start R and want to use the servr package.
Next, navigate to the directory on your computer where you want to start the static server, using the setwd function. For example, if the directory you wish to serve is located at C:\tmp\examples, then you need to execute the following expression:
Note that the path parts need to be separated with \\, not with \!
Finally, the server is started with the httd function:
Running that last expression should open the browser window with the served directory automatically). Otherwise, you can open the served site by browsing to the following URL (Figure H.2):
http://localhost:4321/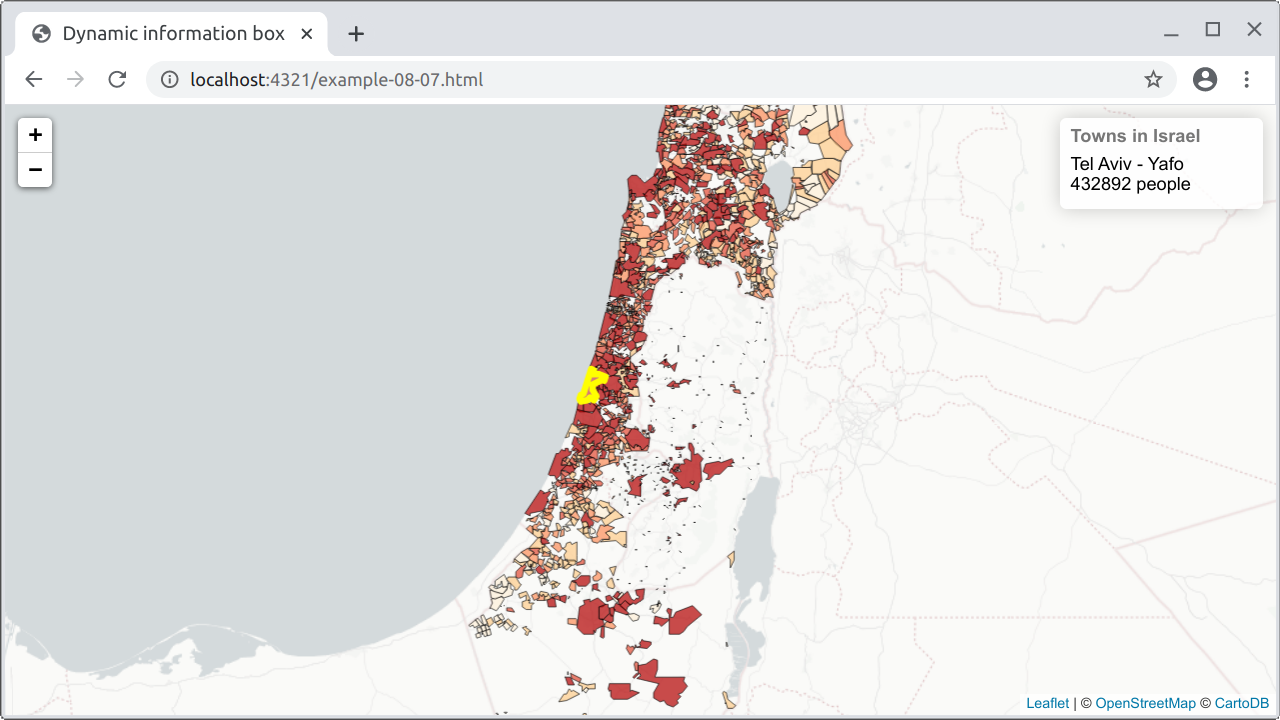
FIGURE H.2: Page served using R package servr
Bassett, Lindsay. 2015. Introduction to JavaScript Object Notation: a to-the-point guide to JSON. Sebastopol, CA, USA: O’Reilly Media, Inc.
Crickard III, Paul. 2014. Leaflet.js Essentials. Birmingham, UK: Packt Publishing Ltd.
Crockford, Douglas. 2008. JavaScript: The Good Parts. Sebastopol, CA, USA: O’Reilly Media, Inc.
DeBarros, Anthony. 2018. Practical Sql: A Beginner’s Guide to Storytelling with Data. San Francisco, CA, USA: No Starch Press.
Dent, Borden D, Jeffrey S Torguson, and Thomas W Hodler. 2008. Cartography: Thematic Map Design. 6th ed. New York, NY, USA: WCB/McGraw-Hill Boston.
Dincer, Alper, and Balkan Uraz. 2013. Google Maps Javascript Api Cookbook. Birmingham, UK: Packt Publishing Ltd.
Farkas, Gábor. 2016. Mastering Openlayers 3. Birmingham, UK: Packt Publishing Ltd.
Gratier, Thomas, Paul Spencer, and Erik Hazzard. 2015. OpenLayers 3: Beginner’s Guide. Packt Publishing Ltd.
Janert, Philipp K. 2019. D3 for the Impatient: Interactive Graphics for Programmers and Scientists. Sebastopol, CA, USA: O’Reilly Media, Inc.
Langley, Peter J, and Antonio Santiago Perez. 2016. OpenLayers 3.x Cookbook. 2nd ed. Birmingham, UK: Packt Publishing Ltd.
Murray, Scott. 2017. Interactive Data Visualization for the Web: An Introduction to Designing with D3. Sebastopol, CA, USA: O’Reilly Media, Inc.
Murrell, Paul. 2009. Introduction to Data Technologies. Boca Raton, FL, USA: Chapman; Hall/CRC.
Neuwirth, Erich. 2014. RColorBrewer: ColorBrewer Palettes. https://CRAN.R-project.org/package=RColorBrewer.
Newton, Thomas, and Oscar Villarreal. 2014. Learning D3.js Mapping. Birmingham, UK: Packt Publishing Ltd.
Nield, Thomas. 2016. Getting Started with Sql: A Hands-on Approach for Beginners. Sebastopol, CA, USA: O’Reilly Media, Inc.
Obe, R, and L Hsu. 2020. PostGIS in Action. 3rd ed. Shelter Island, NY, USA.: Manning Publications Co.
Pebesma, Edzer. 2018. “Simple Features for R: Standardized Support for Spatial Vector Data.” The R Journal 10 (1): 439–46. https://journal.r-project.org/archive/2018/RJ-2018-009/index.html.
QGIS Development Team. 2018. QGIS Geographic Information System. Open Source Geospatial Foundation. http://qgis.osgeo.org.
R Core Team. 2018. R: A Language and Environment for Statistical Computing. Vienna, Austria: R Foundation for Statistical Computing. https://www.R-project.org/.
Rubalcava, Rene. 2015. ArcGIS Web Development. Shelter Island, NY, USA.: Manning Publications Co.
South, Andy. 2011. “rworldmap: A New R package for Mapping Global Data.” The R Journal 3 (1): 35–43. http://journal.r-project.org/archive/2011-1/RJournal_2011-1_South.pdf.
Tufte, Edward. 2001. The Quantitative Display of Information. 2nd ed. Cheshire, CT, USA: Graphics Press.
Wickham, Hadley. 2018. Nycflights13: Flights That Departed Nyc in 2013. https://CRAN.R-project.org/package=nycflights13.
Wilke, Claus O. 2019. Fundamentals of Data Visualization: A Primer on Making Informative and Compelling Figures. Sebastopol, CA, USA: O’Reilly Media, Inc.
Xie, Yihui. 2016. Bookdown: Authoring Books and Technical Documents with R Markdown. Boca Raton, FL, USA: Chapman; Hall/CRC. https://github.com/rstudio/bookdown.
———. 2018. Bookdown: Authoring Books and Technical Documents with R Markdown. https://github.com/rstudio/bookdown.