D Exercise 02
Last updated: 2021-03-31 00:29:17
D.1 Question 1
- Run the following four expressions to load two vectors named
yearandco2into memory:
data(co2)
means = aggregate(co2, FUN = mean)
year = as.vector(time(means))
co2 = as.vector(means)- The
co2vector contains \(CO_2\) measurements in the atmosphere, in ppm units, during the period 1959-1997. Theyearvector contains the corresponding years. - Calculate a vector of \(CO_2\) differences between consecutive years, that is:
- \(CO_2\) in 1960 minus \(CO_2\) in 1959
- \(CO_2\) in 1961 minus \(CO_2\) in 1960
- and so on…
- Create a plot (Figure D.1) with lines and points showing the consecutive \(CO_2\) differences as function of time (1960, 1961, etc.), in black
- The difference in \(CO_2\) concentration between 2020 and 2019 was equal to 2.64. Add a point in red representing that difference to your plot (use a different point shape, such as
pch=4).
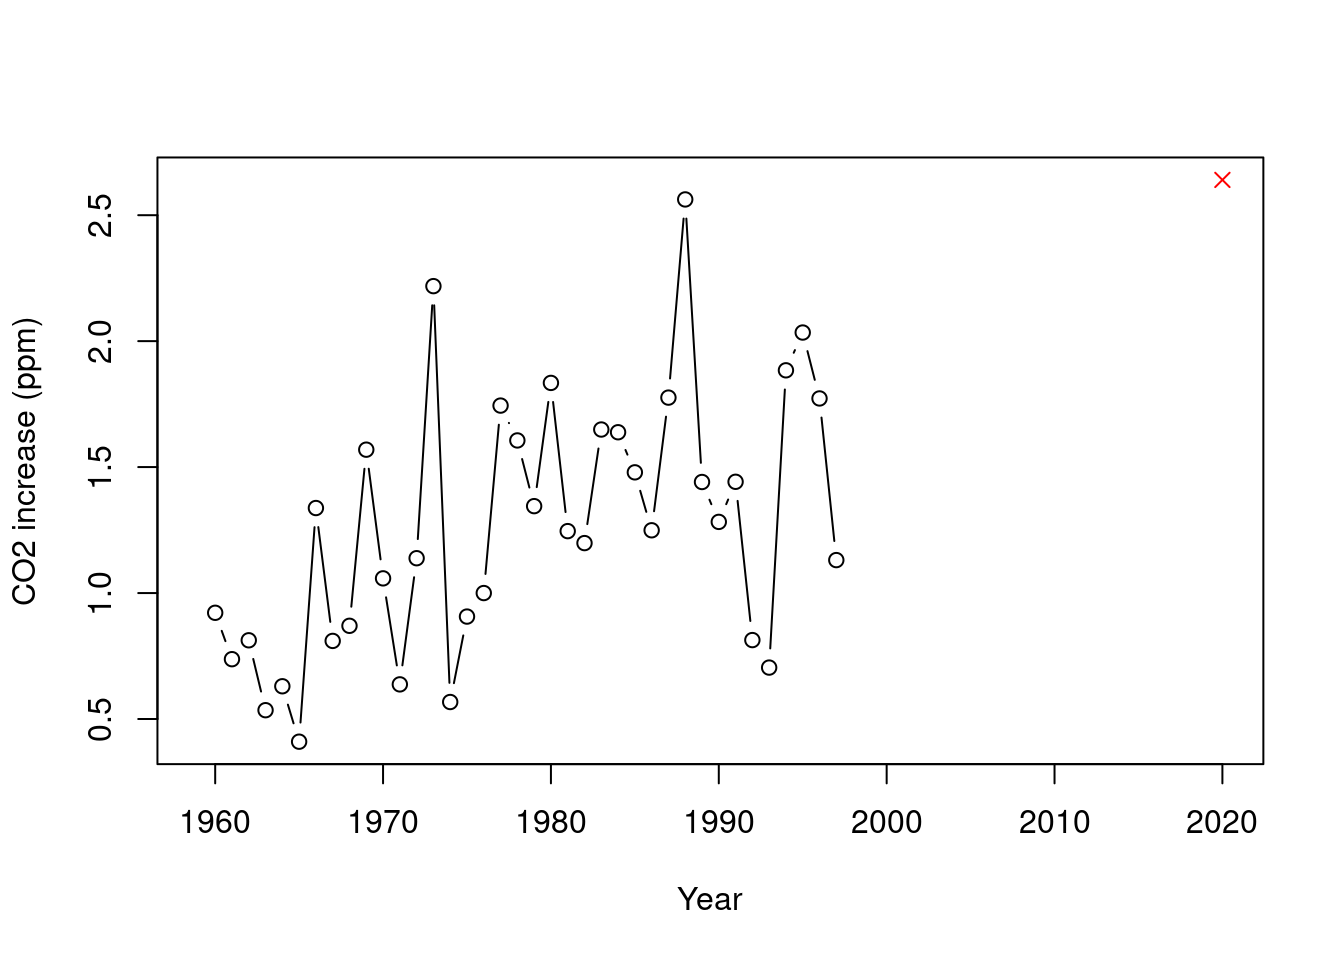
Figure D.1: \(CO_2\) over time
(50 points)
D.2 Question 2
- Read the
rainfall.csvfile into adata.frameobject. - Calculate and print a vector with the station names where at least one of the months has >180 mm of rainfall.
## [1] "Golan Farm" "Eilon"      "Fasutta"    "Yehiam"     "Kfar Mahol"
## [6] "Meron" "Horashim"- You can define and use the vector
mwith month names in your code, to subset the columns with monthly rainfall amounts, as shown in Section 4.4.3:
m = c("sep","oct","nov","dec","jan","feb","mar","apr","may")(50 points)