H Exercise 06
Last updated: 2021-03-31 00:29:34
H.1 Question 1
- Read the
MOD13A3_2000_2019.tifraster to a multi-band raster object. This raster is a series of NDVI images from southern Israel. The date each layer refers to is recorded in the correspondingMOD13A3_2000_2019_dates.csvfile. - Calculate a 12-band raster that will contain the average NDVI per pixel (excluding
NA) for each month. The first band will contain the maximal values per pixel in all images taken in January, the second band will contain the maximal values per pixel in all images taken in February, and so on. Use corresponding theMOD13A3_2000_2019_dates.csvtable to determine the layers corresponding to each month. - Plot the resulting raster as shown in Figure H.1 (including month names). Use
breaks="equal"for equal color breaks. - Remember: you cannot use the
rasterpackage in your solution! (see Section B.5.5.)
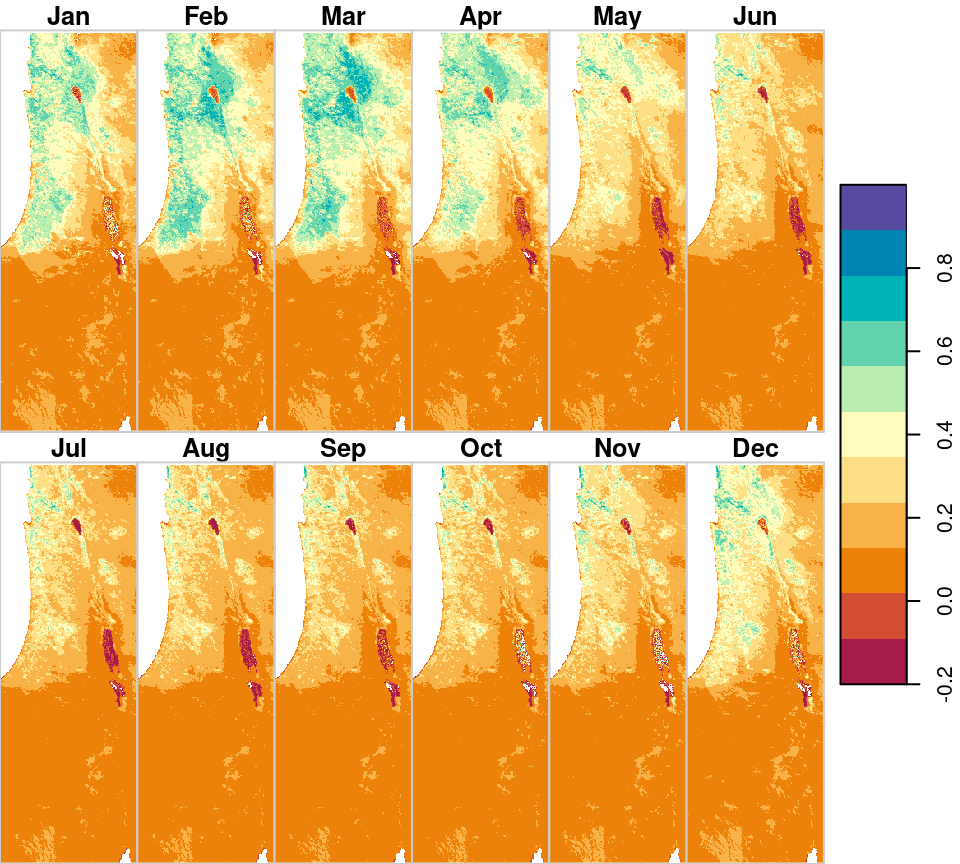
Figure H.1: Average NDVI value per month in modis_south.tif
(50 points)
H.2 Question 2
- Calculate a line that goes through all of the meteorological stations in
rainfall.csv, according to annual rainfall order. (The line starts from the station that has the smallest annual rainfall, and ends in the station that has the largest annual rainfall.) - Print the resulting line length, in \(km\).
- Plot (Figure H.2):
- The line, in
"lightgrey" - The station locations, as circles, in
"darkgrey" - Text labels with the names of the stations that have the lowest and highest amount of annual rainfall, in
"red"
- The line, in
## 11261.79 [km]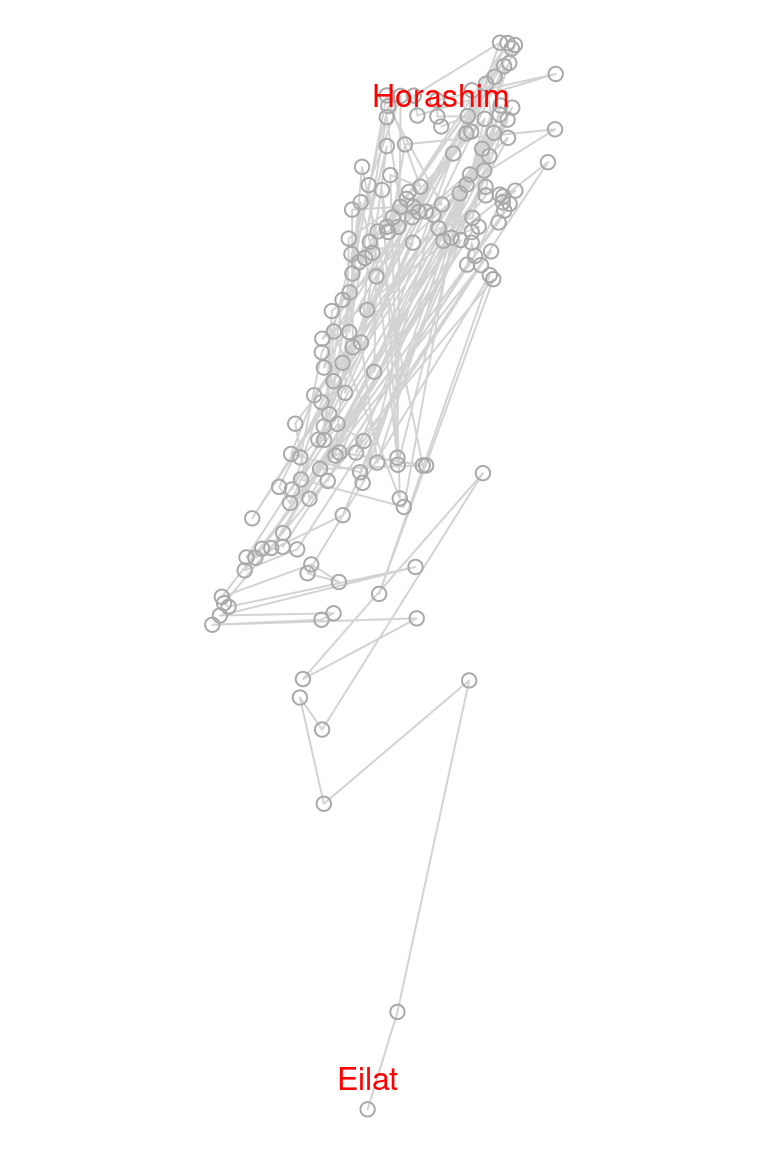
Figure H.2: Path through all meteorological stations in rainfall.csv, from south to north
(50 points)