From “Vector layers (geopandas)”
Contents
From “Vector layers (geopandas)”#
Last updated: 2023-02-25 13:36:34
Exercise 08-a#
import geopandas as gpd
# Read and subset
stat = gpd.read_file("data/statisticalareas_demography2019.gdb")
stat = stat[["YISHUV_STAT11", "SHEM_YISHUV", "SHEM_YISHUV_ENGLISH", "Pop_Total", "geometry"]]
# Examine CRS
stat.crs
<Derived Projected CRS: EPSG:2039>
Name: Israel 1993 / Israeli TM Grid
Axis Info [cartesian]:
- E[east]: Easting (metre)
- N[north]: Northing (metre)
Area of Use:
- name: Israel - onshore; Palestine Territory - onshore.
- bounds: (34.17, 29.45, 35.69, 33.28)
Coordinate Operation:
- name: Israeli TM
- method: Transverse Mercator
Datum: Israel 1993
- Ellipsoid: GRS 1980
- Prime Meridian: Greenwich
# Feature count
stat.shape[0]
3195
# Are there any duplicates in the 'YISHUV_STAT11' column?
stat["YISHUV_STAT11"].duplicated().any()
False
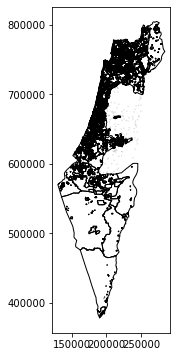
# Plot
stat.plot(edgecolor="black", color="none");
# Subset 'Beer-Sheva'
sel = stat["SHEM_YISHUV"] == "באר שבע"
stat1 = stat[sel]
# Plot
stat1.plot(column="Pop_Total", edgecolor="black", cmap="Reds", legend=True);
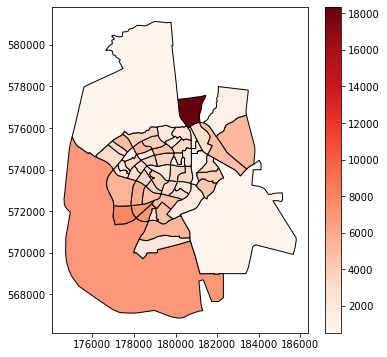
# Feature count
stat1.shape[0]
62
# Sum of population
stat1["Pop_Total"].sum()
209685.0
Exercise 08-b#
import pandas as pd
import geopandas as gpd
import shapely.geometry
# Read
agency = pd.read_csv("data/gtfs/agency.txt")
routes = pd.read_csv("data/gtfs/routes.txt")
trips = pd.read_csv("data/gtfs/trips.txt")
shapes = pd.read_csv("data/gtfs/shapes.txt")
# Subset
agency = agency[["agency_id", "agency_name"]]
routes = routes[["route_id", "agency_id", "route_short_name", "route_long_name"]]
trips = trips[["trip_id", "route_id", "shape_id"]]
shapes = shapes[["shape_id", "shape_pt_sequence", "shape_pt_lon", "shape_pt_lat"]]
# Subset agency
agency = agency[agency["agency_name"] == "דן באר שבע"]
routes = routes[routes["agency_id"] == agency["agency_id"].iloc[0]]
routes = routes.drop("agency_id", axis=1)
# Drop duplicate trips
trips = trips.drop_duplicates(subset="route_id")
trips = trips.drop("trip_id", axis=1)
# Join routes with shapes
routes = pd.merge(routes, trips, on="route_id", how="left")
routes = pd.merge(routes, shapes, on="shape_id", how="left")
# To points
geom = gpd.points_from_xy(routes["shape_pt_lon"], routes["shape_pt_lat"], crs=4326)
routes = gpd.GeoDataFrame(data=routes, geometry=geom)
routes = routes.drop(["shape_pt_lon", "shape_pt_lat"], axis=1)
# To lines
routes = routes.groupby("route_id").agg({
    "route_short_name": "first",
    "route_long_name": "first",
    "geometry": lambda x: shapely.geometry.LineString(x.to_list()),
}).reset_index()
routes = gpd.GeoDataFrame(routes, crs=4326)
routes
| route_id | route_short_name | route_long_name | geometry | |
|---|---|---|---|---|
| 0 | 142 | 2א | שד. הצנחנים / צבי בן יעקב-באר ש... | LINESTRING (34.77787 31.22497, ... |
| 1 | 143 | 2א | מסוף רמות-באר שבע<->שד. הצנחנים... | LINESTRING (34.82207 31.28003, ... |
| 2 | 178 | 14א | ת. רכבת ב''ש צפון-באר שבע<->שד.... | LINESTRING (34.80885 31.26133, ... |
| 3 | 180 | 14א | שד. הצנחנים / צבי בן יעקב-באר ש... | LINESTRING (34.77787 31.22497, ... |
| 4 | 185 | 16א | כפר האירוסים/דרך אילן רמון-באר ... | LINESTRING (34.75704 31.25477, ... |
| ... | ... | ... | ... | ... |
| 66 | 27981 | 27 | ת.מרכזית/עירוניים לדרום-באר שבע... | LINESTRING (34.79791 31.24329, ... |
| 67 | 27982 | 27א | הברזל/החורש-באר שבע<->מכללה טכנ... | LINESTRING (34.80872 31.21809, ... |
| 68 | 27983 | 27 | מכללה טכנולוגית חיל האוויר/דרך ... | LINESTRING (34.75665 31.25459, ... |
| 69 | 27984 | 27א | מכללה טכנולוגית חיל האוויר/דרך ... | LINESTRING (34.75665 31.25459, ... |
| 70 | 28740 | 18א | ת.מרכזית/עירוניים לדרום-באר שבע... | LINESTRING (34.79791 31.24329, ... |
71 rows × 4 columns
# Calculate start points
pnt = [shapely.geometry.Point(line.coords[0]) for line in routes["geometry"].to_list()]
pnt = gpd.GeoSeries(pnt, crs=4326)
pnt
0     POINT (34.77787 31.22497)
1     POINT (34.82207 31.28003)
2     POINT (34.80885 31.26133)
3     POINT (34.77787 31.22497)
4     POINT (34.75704 31.25477)
                ...
66    POINT (34.79791 31.24329)
67    POINT (34.80872 31.21809)
68    POINT (34.75665 31.25459)
69    POINT (34.75665 31.25459)
70    POINT (34.79791 31.24329)
Length: 71, dtype: geometry
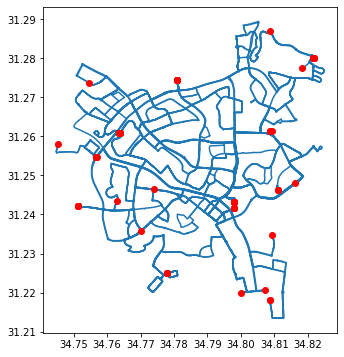
# Plot
base = routes.plot(zorder=1)
pnt.plot(ax=base, color="red", zorder=2);
Exercise 08-c#
import geopandas as gpd

# Read
stat = gpd.read_file("data/statisticalareas_demography2019.gdb")

# Subset columns
sel = ["SHEM_YISHUV", "age_0_4", "age_5_9", "age_10_14", "age_15_19", "Pop_Total"]
stat = stat[sel]
stat
| SHEM_YISHUV | age_0_4 | age_5_9 | age_10_14 | age_15_19 | Pop_Total | |
|---|---|---|---|---|---|---|
| 0 | המעפיל | 72.0 | 89.0 | 109.0 | 73.0 | 869.0 |
| 1 | משגב עם | 34.0 | 15.0 | 19.0 | 26.0 | 339.0 |
| 2 | גאולים | 77.0 | 86.0 | 92.0 | 69.0 | 968.0 |
| 3 | להבות הבשן | 56.0 | 78.0 | 99.0 | 87.0 | 915.0 |
| 4 | מכמורת | 116.0 | 130.0 | 121.0 | 79.0 | 1403.0 |
| ... | ... | ... | ... | ... | ... | ... |
| 3190 | קריית נטפים | 165.0 | 165.0 | 151.0 | 67.0 | 958.0 |
| 3191 | דולב | 215.0 | 190.0 | 174.0 | 143.0 | 1448.0 |
| 3192 | עתניאל | 115.0 | 108.0 | 118.0 | 158.0 | 1044.0 |
| 3193 | יצהר | 412.0 | 357.0 | 240.0 | 81.0 | 1726.0 |
| 3194 | מבואות יריחו | NaN | NaN | NaN | NaN | NaN |
3195 rows × 6 columns
# Replace "No Data" with zero
sel = ["age_0_4", "age_5_9", "age_10_14", "age_15_19", "Pop_Total"]
stat[sel] = stat[sel].fillna(0)
stat
| SHEM_YISHUV | age_0_4 | age_5_9 | age_10_14 | age_15_19 | Pop_Total | |
|---|---|---|---|---|---|---|
| 0 | המעפיל | 72.0 | 89.0 | 109.0 | 73.0 | 869.0 |
| 1 | משגב עם | 34.0 | 15.0 | 19.0 | 26.0 | 339.0 |
| 2 | גאולים | 77.0 | 86.0 | 92.0 | 69.0 | 968.0 |
| 3 | להבות הבשן | 56.0 | 78.0 | 99.0 | 87.0 | 915.0 |
| 4 | מכמורת | 116.0 | 130.0 | 121.0 | 79.0 | 1403.0 |
| ... | ... | ... | ... | ... | ... | ... |
| 3190 | קריית נטפים | 165.0 | 165.0 | 151.0 | 67.0 | 958.0 |
| 3191 | דולב | 215.0 | 190.0 | 174.0 | 143.0 | 1448.0 |
| 3192 | עתניאל | 115.0 | 108.0 | 118.0 | 158.0 | 1044.0 |
| 3193 | יצהר | 412.0 | 357.0 | 240.0 | 81.0 | 1726.0 |
| 3194 | מבואות יריחו | 0.0 | 0.0 | 0.0 | 0.0 | 0.0 |
3195 rows × 6 columns
# Subset towns with total population >5000
sel = stat["Pop_Total"] > 5000
stat = stat[sel].copy()
stat
| SHEM_YISHUV | age_0_4 | age_5_9 | age_10_14 | age_15_19 | Pop_Total | |
|---|---|---|---|---|---|---|
| 28 | ירושלים | 2579.0 | 2594.0 | 2431.0 | 2411.0 | 23581.0 |
| 29 | ירושלים | 3161.0 | 2997.0 | 2815.0 | 2786.0 | 22258.0 |
| 30 | ירושלים | 1714.0 | 1585.0 | 1373.0 | 1364.0 | 11336.0 |
| 31 | ירושלים | 2469.0 | 2436.0 | 2369.0 | 2378.0 | 19591.0 |
| 32 | ירושלים | 3393.0 | 3293.0 | 3172.0 | 3267.0 | 29503.0 |
| ... | ... | ... | ... | ... | ... | ... |
| 3133 | רעננה | 797.0 | 668.0 | 527.0 | 411.0 | 6978.0 |
| 3136 | רעננה | 471.0 | 561.0 | 619.0 | 489.0 | 6680.0 |
| 3142 | שפרעם | 3506.0 | 3431.0 | 3637.0 | 4298.0 | 42137.0 |
| 3152 | טמרה | 3155.0 | 3206.0 | 3451.0 | 3700.0 | 34392.0 |
| 3172 | באר שבע | 437.0 | 400.0 | 384.0 | 393.0 | 5205.0 |
471 rows × 6 columns
# Calculate total population in ages 0-19
stat["Pop_Total_0_19"] = stat["age_0_4"] + stat["age_5_9"] + stat["age_10_14"] + stat["age_15_19"]
stat
| SHEM_YISHUV | age_0_4 | age_5_9 | age_10_14 | age_15_19 | Pop_Total | Pop_Total_0_19 | |
|---|---|---|---|---|---|---|---|
| 28 | ירושלים | 2579.0 | 2594.0 | 2431.0 | 2411.0 | 23581.0 | 10015.0 |
| 29 | ירושלים | 3161.0 | 2997.0 | 2815.0 | 2786.0 | 22258.0 | 11759.0 |
| 30 | ירושלים | 1714.0 | 1585.0 | 1373.0 | 1364.0 | 11336.0 | 6036.0 |
| 31 | ירושלים | 2469.0 | 2436.0 | 2369.0 | 2378.0 | 19591.0 | 9652.0 |
| 32 | ירושלים | 3393.0 | 3293.0 | 3172.0 | 3267.0 | 29503.0 | 13125.0 |
| ... | ... | ... | ... | ... | ... | ... | ... |
| 3133 | רעננה | 797.0 | 668.0 | 527.0 | 411.0 | 6978.0 | 2403.0 |
| 3136 | רעננה | 471.0 | 561.0 | 619.0 | 489.0 | 6680.0 | 2140.0 |
| 3142 | שפרעם | 3506.0 | 3431.0 | 3637.0 | 4298.0 | 42137.0 | 14872.0 |
| 3152 | טמרה | 3155.0 | 3206.0 | 3451.0 | 3700.0 | 34392.0 | 13512.0 |
| 3172 | באר שבע | 437.0 | 400.0 | 384.0 | 393.0 | 5205.0 | 1614.0 |
471 rows × 7 columns
# Aggregate
stat = stat.groupby("SHEM_YISHUV").sum().reset_index()
stat
| SHEM_YISHUV | age_0_4 | age_5_9 | age_10_14 | age_15_19 | Pop_Total | Pop_Total_0_19 | |
|---|---|---|---|---|---|---|---|
| 0 | אבו גוש | 784.0 | 720.0 | 740.0 | 717.0 | 7698.0 | 2961.0 |
| 1 | אבו סנאן | 1281.0 | 1148.0 | 1229.0 | 1428.0 | 14099.0 | 5086.0 |
| 2 | אבן יהודה | 926.0 | 1335.0 | 1482.0 | 1158.0 | 13826.0 | 4901.0 |
| 3 | אום אל-פחם | 5639.0 | 5587.0 | 5955.0 | 6367.0 | 56109.0 | 23548.0 |
| 4 | אופקים | 3112.0 | 2519.0 | 1901.0 | 1489.0 | 21793.0 | 9021.0 |
| ... | ... | ... | ... | ... | ... | ... | ... |
| 174 | שערי תקווה | 564.0 | 645.0 | 638.0 | 481.0 | 6039.0 | 2328.0 |
| 175 | שפרעם | 3506.0 | 3431.0 | 3637.0 | 4298.0 | 42137.0 | 14872.0 |
| 176 | תל אביב -יפו | 7217.0 | 6461.0 | 5473.0 | 4941.0 | 89404.0 | 24092.0 |
| 177 | תל מונד | 881.0 | 1202.0 | 1371.0 | 1346.0 | 13144.0 | 4800.0 |
| 178 | תל שבע | 3536.0 | 3083.0 | 2780.0 | 2770.0 | 20808.0 | 12169.0 |
179 rows × 7 columns
# Calculate ratio
stat["ratio"] = stat["Pop_Total_0_19"] / stat["Pop_Total"]
stat
| SHEM_YISHUV | age_0_4 | age_5_9 | age_10_14 | age_15_19 | Pop_Total | Pop_Total_0_19 | ratio | |
|---|---|---|---|---|---|---|---|---|
| 0 | אבו גוש | 784.0 | 720.0 | 740.0 | 717.0 | 7698.0 | 2961.0 | 0.384645 |
| 1 | אבו סנאן | 1281.0 | 1148.0 | 1229.0 | 1428.0 | 14099.0 | 5086.0 | 0.360735 |
| 2 | אבן יהודה | 926.0 | 1335.0 | 1482.0 | 1158.0 | 13826.0 | 4901.0 | 0.354477 |
| 3 | אום אל-פחם | 5639.0 | 5587.0 | 5955.0 | 6367.0 | 56109.0 | 23548.0 | 0.419683 |
| 4 | אופקים | 3112.0 | 2519.0 | 1901.0 | 1489.0 | 21793.0 | 9021.0 | 0.413940 |
| ... | ... | ... | ... | ... | ... | ... | ... | ... |
| 174 | שערי תקווה | 564.0 | 645.0 | 638.0 | 481.0 | 6039.0 | 2328.0 | 0.385494 |
| 175 | שפרעם | 3506.0 | 3431.0 | 3637.0 | 4298.0 | 42137.0 | 14872.0 | 0.352944 |
| 176 | תל אביב -יפו | 7217.0 | 6461.0 | 5473.0 | 4941.0 | 89404.0 | 24092.0 | 0.269473 |
| 177 | תל מונד | 881.0 | 1202.0 | 1371.0 | 1346.0 | 13144.0 | 4800.0 | 0.365186 |
| 178 | תל שבע | 3536.0 | 3083.0 | 2780.0 | 2770.0 | 20808.0 | 12169.0 | 0.584823 |
179 rows × 8 columns
# Classify and sort
stat["type"] = "old"
sel = stat["ratio"] >= stat["ratio"].mean()
stat.loc[sel, "type"] = "young"
stat.sort_values(by="ratio")
| SHEM_YISHUV | age_0_4 | age_5_9 | age_10_14 | age_15_19 | Pop_Total | Pop_Total_0_19 | ratio | type | |
|---|---|---|---|---|---|---|---|---|---|
| 149 | קריית ביאליק | 696.0 | 646.0 | 634.0 | 635.0 | 10980.0 | 2611.0 | 0.237796 | old |
| 118 | נשר | 459.0 | 491.0 | 446.0 | 403.0 | 7123.0 | 1799.0 | 0.252562 | old |
| 32 | בני עי"ש | 518.0 | 460.0 | 389.0 | 424.0 | 6978.0 | 1791.0 | 0.256664 | old |
| 164 | רמת גן | 4106.0 | 3764.0 | 3511.0 | 3077.0 | 53747.0 | 14458.0 | 0.269001 | old |
| 176 | תל אביב -יפו | 7217.0 | 6461.0 | 5473.0 | 4941.0 | 89404.0 | 24092.0 | 0.269473 | old |
| ... | ... | ... | ... | ... | ... | ... | ... | ... | ... |
| 63 | חורה | 4087.0 | 3553.0 | 3001.0 | 2799.0 | 22337.0 | 13440.0 | 0.601692 | young |
| 29 | בית שמש | 18999.0 | 17515.0 | 14383.0 | 9976.0 | 100881.0 | 60873.0 | 0.603414 | young |
| 10 | אלעד | 7271.0 | 8064.0 | 8142.0 | 6457.0 | 48764.0 | 29934.0 | 0.613854 | young |
| 30 | ביתר עילית | 9963.0 | 8915.0 | 7437.0 | 4291.0 | 46889.0 | 30606.0 | 0.652733 | young |
| 105 | מודיעין עילית | 14246.0 | 13303.0 | 9782.0 | 5517.0 | 62919.0 | 42848.0 | 0.681003 | young |
179 rows × 9 columns
Exercise 08-d#
import pandas as pd
import geopandas as gpd
import shapely.geometry
# Read
agency = pd.read_csv("data/gtfs/agency.txt")
routes = pd.read_csv("data/gtfs/routes.txt")
trips = pd.read_csv("data/gtfs/trips.txt")
shapes = pd.read_csv("data/gtfs/shapes.txt")
# Subset
agency = agency[["agency_id", "agency_name"]]
routes = routes[["route_id", "agency_id", "route_short_name", "route_long_name"]]
trips = trips[["trip_id", "route_id", "shape_id"]]
shapes = shapes[["shape_id", "shape_pt_sequence", "shape_pt_lon", "shape_pt_lat"]]
# Subset agency
agency = agency[agency["agency_name"] == "מטרופולין"]
routes = routes[routes["agency_id"] == agency["agency_id"].iloc[0]]
routes = routes.drop("agency_id", axis=1)
# Drop duplicate trips
trips = trips.drop_duplicates(subset="route_id")
trips = trips.drop("trip_id", axis=1)
# Join routes with shapes
routes = pd.merge(routes, trips, on="route_id", how="left")
routes = pd.merge(routes, shapes, on="shape_id", how="left")
# To points
geom = gpd.points_from_xy(routes["shape_pt_lon"], routes["shape_pt_lat"], crs=4326)
routes = gpd.GeoDataFrame(data=routes, geometry=geom)
routes = routes.drop(["shape_pt_lon", "shape_pt_lat"], axis=1)
# To lines
routes = routes.groupby("route_id").agg({
    "route_short_name": "first",
    "route_long_name": "first",
    "geometry": lambda x: shapely.geometry.LineString(x.to_list()),
}).reset_index()
routes = gpd.GeoDataFrame(routes, crs=4326)
# Calculate 'delta_lon' and 'delta_lat'
b = routes.bounds
delta_lon = b["maxx"] - b["minx"]
delta_lat = b["maxy"] - b["miny"]
# Subset maximum 'delta_lon' and 'delta_lat'
routes1 = routes.iloc[[delta_lon.idxmax(), delta_lat.idxmax()], :]
routes1
| route_id | route_short_name | route_long_name | geometry | |
|---|---|---|---|---|
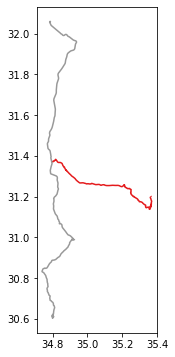
| 560 | 26209 | 400 | מלון הוד-תמר<->ת. רכבת להבים רה... | LINESTRING (35.36330 31.20181, ... |
| 310 | 11718 | 660 | מרכז תפוח-מצפה רמון<->ת. מרכזית... | LINESTRING (34.80221 30.61085, ... |
# Plot
routes1.plot(column="route_short_name", cmap="Set1");