From “Arrays (numpy)”
Contents
From “Arrays (numpy)”#
Last updated: 2023-02-25 13:37:44
Exercise 04-g#
import numpy as np

# Shape (e.g., 10 for '10*10')
s = 10

# Create "template"
x = np.tile(0, s**2)
x = x.reshape((s, s))

# Calculate i*j
for i in np.arange(x.shape[0]):
    for j in np.arange(x.shape[1]):
        x[i,j] = (i+1)*(j+1)

# Print
x
array([[  1,   2,   3,   4,   5,   6,   7,   8,   9,  10],
       [  2,   4,   6,   8,  10,  12,  14,  16,  18,  20],
       [  3,   6,   9,  12,  15,  18,  21,  24,  27,  30],
       [  4,   8,  12,  16,  20,  24,  28,  32,  36,  40],
       [  5,  10,  15,  20,  25,  30,  35,  40,  45,  50],
       [  6,  12,  18,  24,  30,  36,  42,  48,  54,  60],
       [  7,  14,  21,  28,  35,  42,  49,  56,  63,  70],
       [  8,  16,  24,  32,  40,  48,  56,  64,  72,  80],
       [  9,  18,  27,  36,  45,  54,  63,  72,  81,  90],
       [ 10,  20,  30,  40,  50,  60,  70,  80,  90, 100]])
Exercise 04-h#
import matplotlib.pyplot as plt
m = np.genfromtxt("data/carmel.csv", delimiter = ",")
np.nanmin(m)
-14.0
np.nanmax(m)
541.0
m1 = np.isnan(m)
plot = plt.imshow(m1);
fig = plot.get_figure()
glue("exercise-04-h1", fig, display=False)
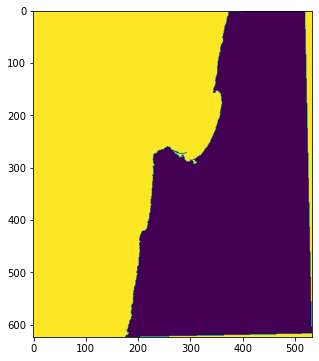
m1.mean()
0.5275713186125944
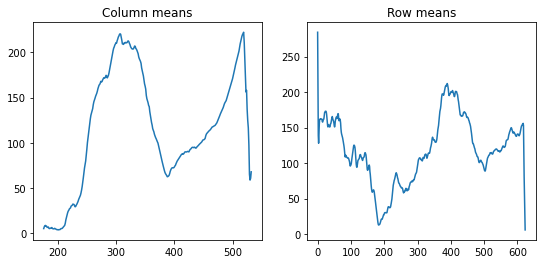
colmeans = np.nanmean(m, axis=0)
rowmeans = np.nanmean(m, axis=1)
/tmp/ipykernel_12611/4262640268.py:1: RuntimeWarning: Mean of empty slice
  colmeans = np.nanmean(m, axis=0)
fig, ax = plt.subplots(1, 2, figsize=(9, 4))
ax[0].plot(colmeans)
ax[0].set_title("Column means")
ax[1].plot(rowmeans)
ax[1].set_title("Row means")
glue("exercise-04-h2", fig, display=False)