From “Rasters (rasterio)”
Contents
From “Rasters (rasterio)”#
Last updated: 2023-02-25 13:38:27
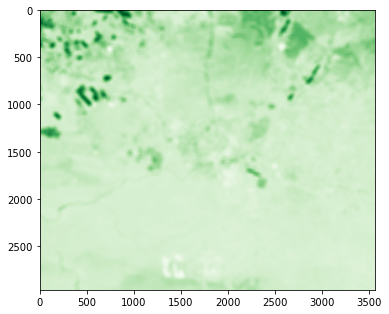
Exercise 10-f#
import rasterio
from rasterio.plot import show
import scipy.ndimage
src = rasterio.open("output/sentinel2.tif")
r = src.read()
r = r / 10000
r[r > 1] = 1
ndvi = (r[3]-r[2]) / (r[3] + r[2])
ndvi31 = scipy.ndimage.uniform_filter(ndvi, 51)
show(ndvi31, cmap="Greens");
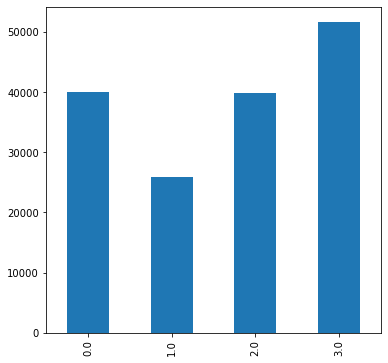
Exercise 10-g#
import rasterio
import numpy as np
from rasterio.plot import show
# Read
src = rasterio.open('output/carmel_aspect.tif')
r = src.read(1)
# Set "No Data" to 'np.nan'
r[r == src.nodata] = np.nan
# Reclassify
s = r.copy()
s[(r > 315) | (r <= 45)] = 0
s[(r > 45) & (r <= 135)] = 1
s[(r > 135) & (r <= 225)] = 2
s[(r > 225) & (r <= 315)] = 3
# Write
dst = rasterio.open('output/carmel_aspect_reclassified.tif', 'w', **src.meta)
dst.write(s, 1)
dst.close()
# Barplot
x = s.flatten()
x = pd.Series(x)
x = x.value_counts().sort_index()
x.plot.bar();
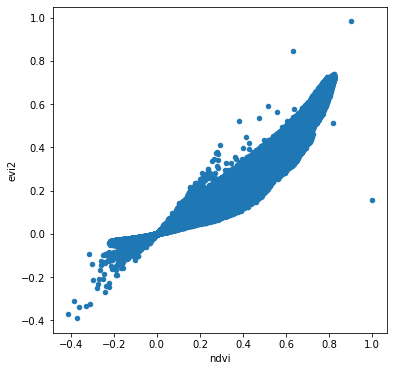
Exercise 10-h#
import rasterio
import pandas as pd
from rasterio.plot import show
# Read
src = rasterio.open('output/sentinel2.tif')
r = src.read()
# Rescale
r = r / 10000
# Calculate EVI2
L = 1
C1 = 6
C2 = 7.5
G = 2.5
blue = r[0, :, :]
red = r[2, :, :]
nir = r[3, :, :]
evi2 = 2.5 * (nir - red) / (nir + 2.4 * red + 1)
# Scatterplot of NDVI vs. EVI
ndvi = (r[3]-r[2]) / (r[3] + r[2])
dat = pd.DataFrame({
    'ndvi': ndvi.flatten(),
    'evi2': evi2.flatten(),
})
dat.plot.scatter(x='ndvi', y='evi2');