
Preface
Contents
Preface#
Last updated: 2023-02-25 13:49:22
Welcome#
This book contains the materials of the 3-credit undergraduate course named Introduction to Spatial Data Programming with Python, given at the Department of Geography and Environmental Development, Ben-Gurion University of the Negev, in Spring 2022.
The structure of the book is as follows:
This section (see Preface) covers the context (why learn Python for working with spatial data?) and technical details about the material (which packages and sample data are we going to use?)
INTRO TO PYTHON (see Setting up the environment, Python basics, Conditionals and loops) explains how to set up and use the Python working environment, and introduces the basics of the Python language, which are prerequisites for the later chapters
WORKING WITH DATA (see Arrays (numpy), Tables (pandas), Table reshaping and joins) covers the
numpyandpandaspackages for working with array and tabular data in Python, respectivelyVECTOR LAYERS (see Geometries (shapely), Vector layers (geopandas), Geometric operations) covers the
shapelyandgeopandaspackages for working with vector layers in PythonRASTERS (see Rasters (rasterio) and Raster-vector interactions) covers the
rasteriopackage for working with rasters in PythonARCPRO SCRIPTING (see ArcGIS Pro scripting (arcpy)) introduces the
arcpypackage for writing Python scripts to automate the ArcPro GIS software
What is Python?#
Python (Fig. 1) is a general purpose programming language. Python is used for a wide variety of purposes, such as:
Web servers and web applications (e.g., https://en.wikipedia.org/wiki/Django_(web_framework))
Scientific computing and data science (e.g., https://en.wikipedia.org/wiki/NumPy)
Machine learning and AI (e.g., https://en.wikipedia.org/wiki/TensorFlow)
Scripting language in other software (e.g., https://en.wikipedia.org/wiki/ArcGIS_Pro)
Fig. 1 Python website (https://www.python.org/)#
Python is open-source, has an intuitive syntax, and it is very popular. Among programming language questions on StackOverflow, Python currently stands at 1st place with 16% of all questions (Fig. 2).
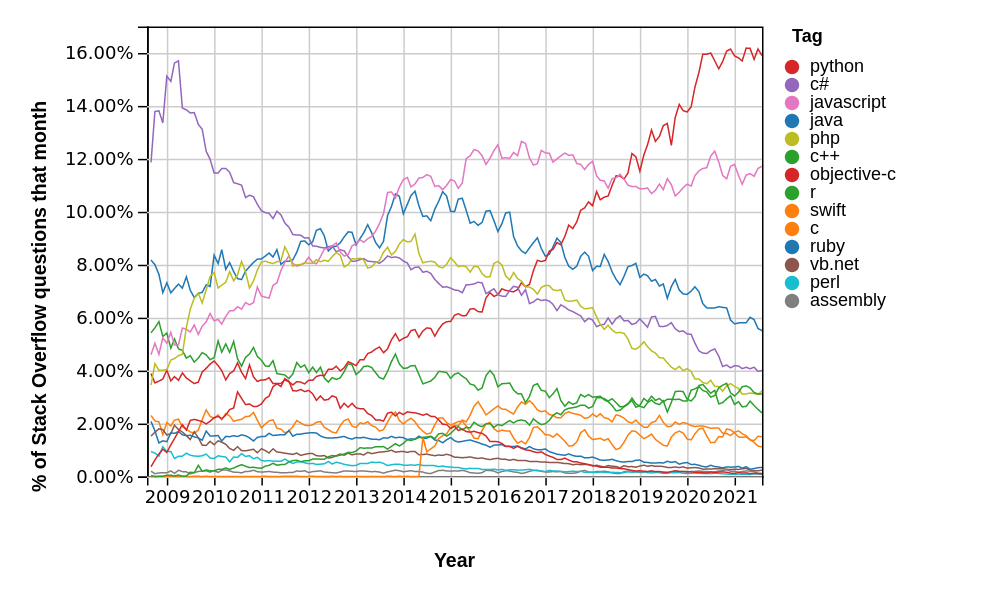
Fig. 2 Most popular programming languages, according to StackOverflow question proportions (https://insights.stackoverflow.com/trends)#
Python was initially released in 1991. The present version, which we learn in this book, is Python 3, released in 2008.
Why choose Python for spatial data?#
There are numerous reasons to choose Python for working with spatial data. These include general reasons for working through a Command Line Interface (CLI), as opposed to Graphical User Interfaces (GUI), that is, roughly speaking, writing code as opposed to clicking on menu buttons:
Programming facilitates automation and reproducibility of our workflows. When programming, we interact with the computer through scripts. Therefore, the workflows we create can be repeated, adapted for other use cases in the future, and shared with other people who would like to accurately reproduce your workflow.
Through programming, the user is “forced” to have a deeper understanding of the underlying data and the computational algorithms behind GIS workflows. Working through a CLI usually involves knowledge of lower-level details and “forces” us to be specific about what we want to do.
There are also specific advantages of Python, over other CLI approaches:
Python and the packages we are going to learn (see What are we going to learn?) are free and open-source, which means that you can setup the workflows we learn at any place and time, at zero cost.
The Python syntax was designed to be clear and straightforward. This means that Python has a (relatively) gentle learning curve, and that Python programs are often easy to read and understand, compared to other programming languages.
Python is a widespread and extremely popular language, in the GIS as well as other industries, and in academic research (Fig. 2). For example, according to the 2021 StackOverflow survey, Python was the 3rd (after JavaScript and HTML) most popular programming technology, with 48.2% of respondents using it 1. A recent FOSS4G (Free and Open Source Software for Geospatial) conference (FOSS4G 2021 Buenos Aires), Python was the major programming planguage in the Workshops, with three different 4-hour geospatial Python workshops (Fig. 3).
In addition to being a standalone tool, Python is also used to automate GIS (and other) software, such as ArcGIS/ArcPro (
arcpy) and QGIS (PyQGIS) (see ArcGIS Pro scripting (arcpy)). Often, Python is the main or only CLI interface of GIS software. Google Earth Engine, a polular cloud computing environment for working with big spatial data has an official Python API.Finally, interfaces to deep learning libraries, such as Keras and PyTorch, are almost exclusively accessed through Python. Among other uses, deep learning is applicable to spatial analysis tasks such as object detection and image classification in remote sensing (Fig. 4).
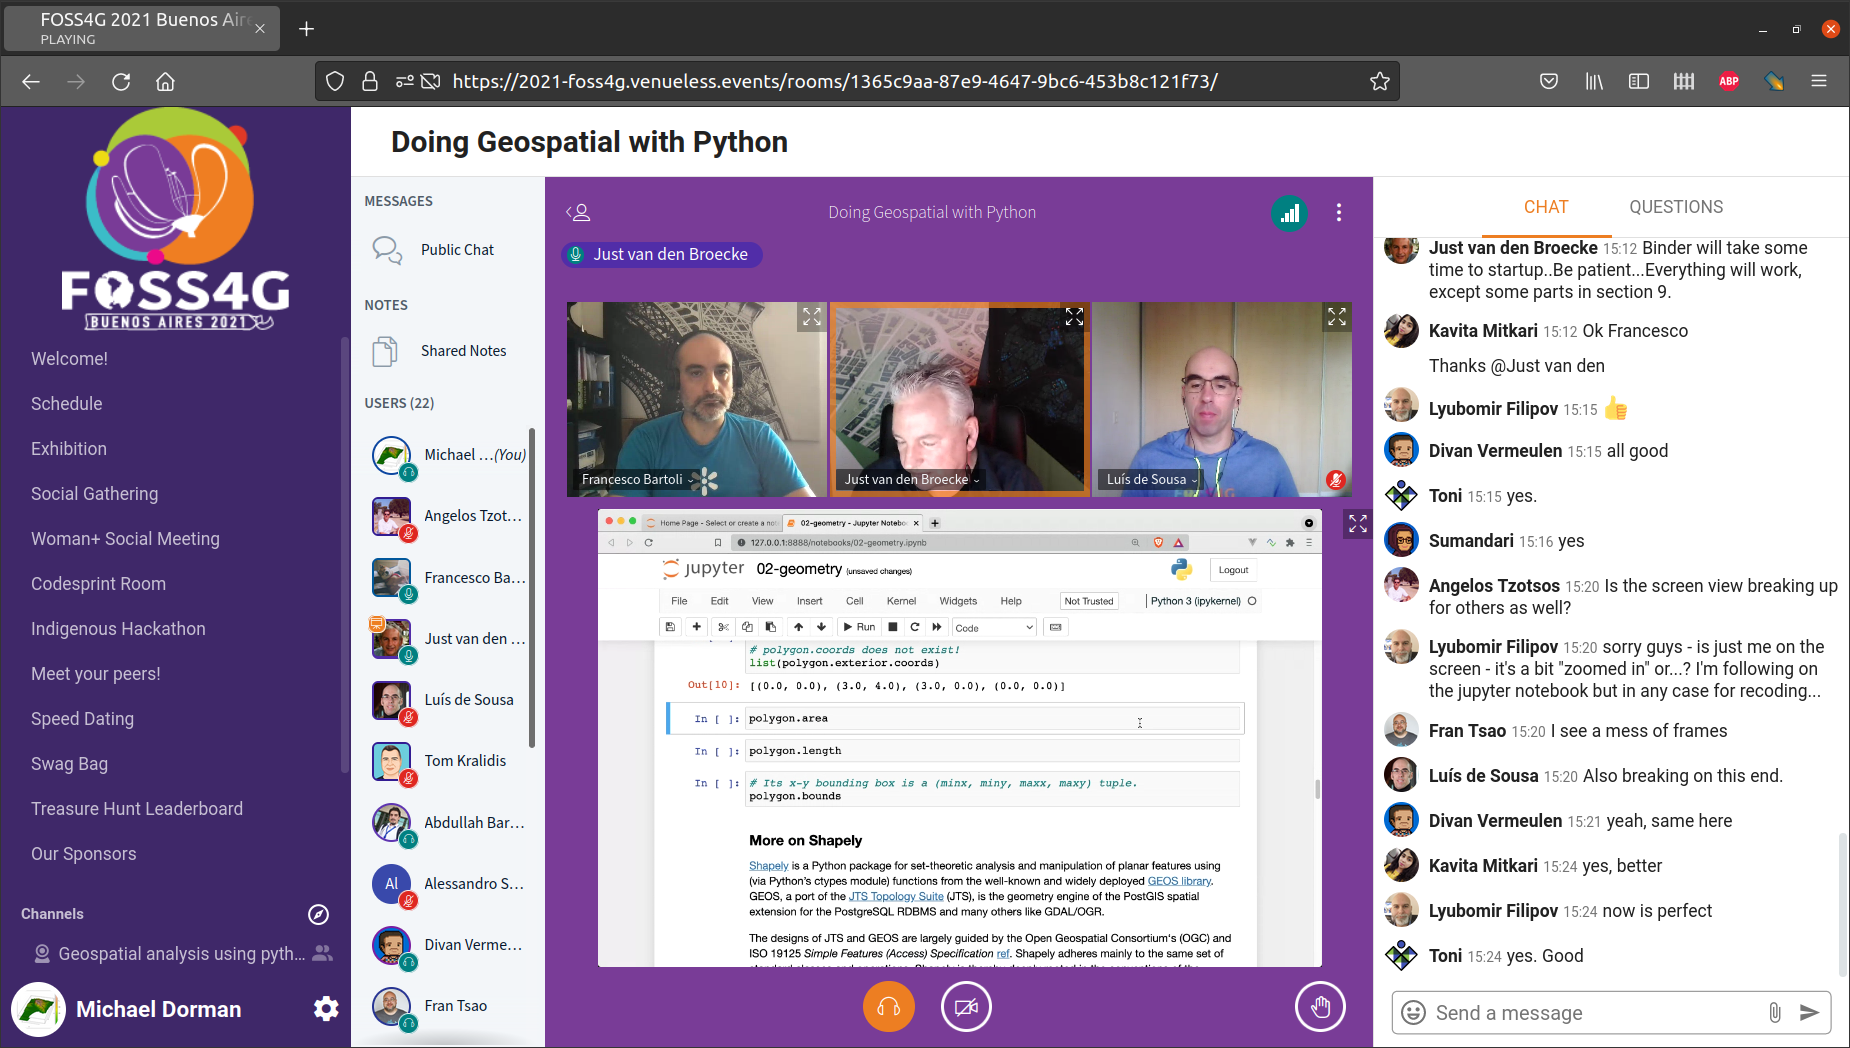
Fig. 3 Doing Geospatial with Python workshop in the FOSS4G 2021 Buenos Aires conference#
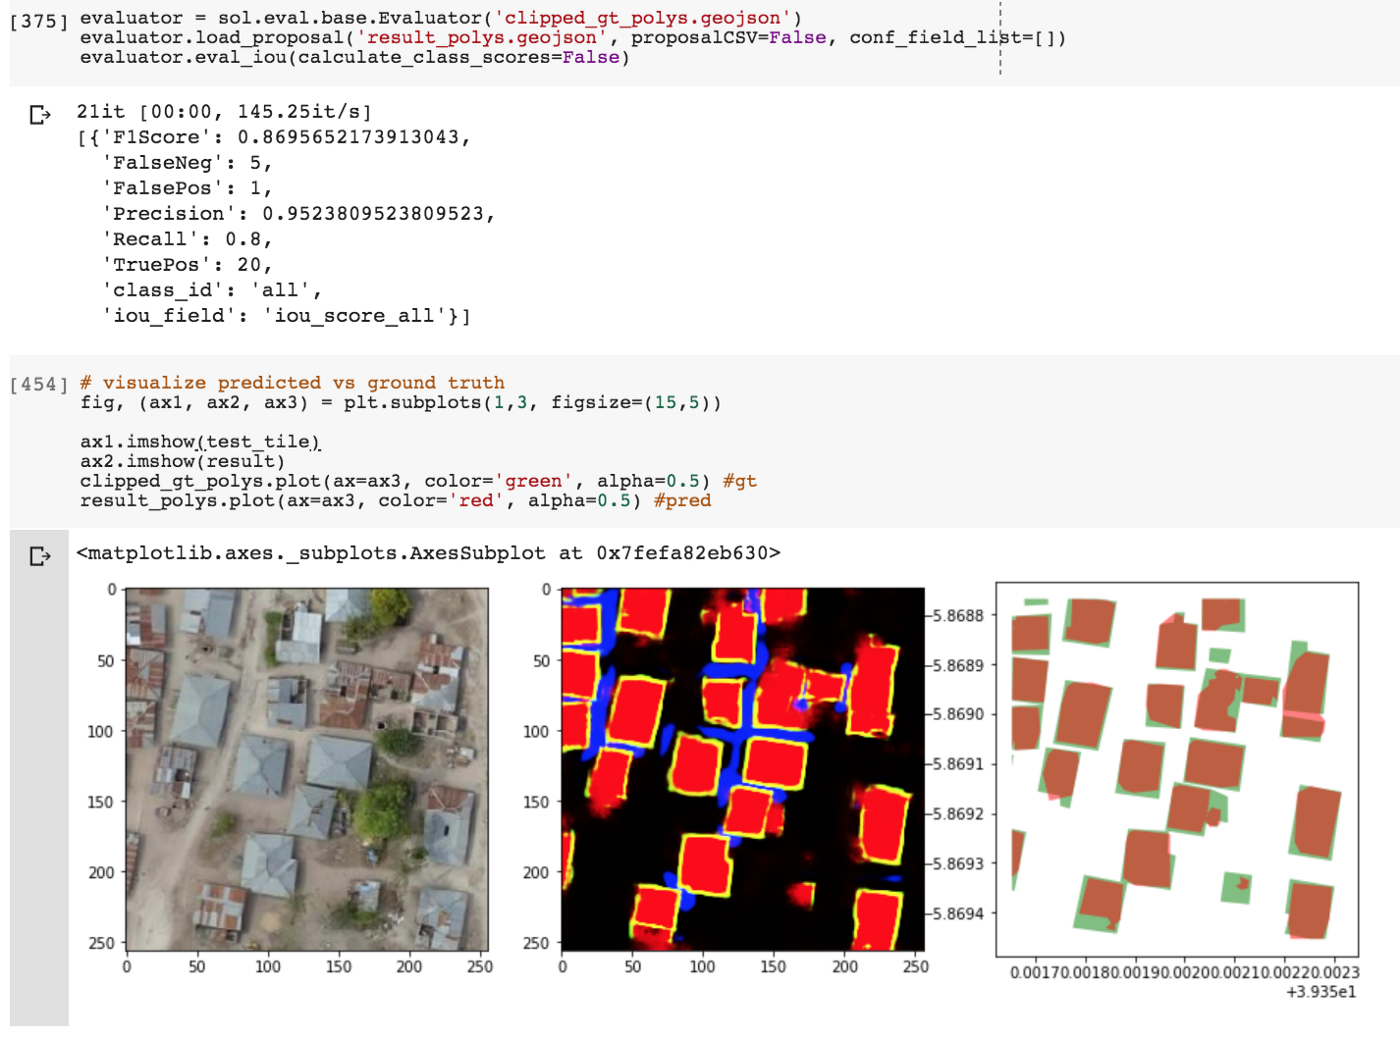
Fig. 4 Building segmentation result, using deep learning with Python (source: https://medium.com/@anthropoco/how-to-segment-buildings-on-drone-imagery-with-fast-ai-cloud-native-geodata-tools-ae249612c321)#
Nevertheless, Python has disadvantages over other CLI approaches. For example, the R programming language can be considred as an alternative CLI tool for spatial analysis ([LNM19], [BPGomezR13]), with the folowing advantages over Python:
Python is a general-purpose language, which means that it is not natively designed to work with data. For example, the Python standard library does not support basic data science concepts and data structures, such as “No Data” values, arrays, and tables. This means we almost always need to rely on third-party packages such as
numpy(see Arrays (numpy)) andpandas(see Tables (pandas)) when working with data. In R, the standard library covers all of those data-related concepts and much more.Python’s spatial analysis “ecosystem” is more scattered, with numerous packages independently developed and not always inter-compatible. For example, although vector-based analysis is mostly contained in a single package called
geopandas(see Vector layers (geopandas)), there are multiple packages for raster-based analysis, each with its own features, level of abstraction, advantages, and disadvantages, such asrasterio(see Rasters (rasterio) and Raster-vector interactions),xarray,rioxarray,earthpy, andgeowombat. Consequently, vector-based and raster-based ecosystems are not well integrated. For example, a basic operations such as zonal statistics requires yet another third party package calledrasterstats(see Zonal statistics). In R there is much tighter integration between spatial analysis packages. For example, the pair of compatible R packagessfandstarscover most vector-based and raster-based analysis tasks, respectively.
What are we going to learn?#
In this book, we are going to work with the Python programming language, using packages from the standard library (which is built-in with the Python installation), as well as several third-party Python packages (which need to be installed separately, see Installing packages).
By the end of this book, you will be able to write Python programs to automate processing and analysis of spatial data. You will be able to write Python scripts for spatial analysis workflows consisting of operations such as:
Importing tables, vector layers, and rasters
Filtering and aggregating the data
Calculating new attributes, or reclassifying values to new categories
Making spatial calculations, such as calculating distances, or creating a new buffered layer
Creating simple plots and maps to examine the data at hand
Exporting the results to a new table, a vector layer, or a raster
You will also have a strong background in the fundamental packages for data science in Python, namely numpy and pandas. This is a good starting point for learning data-related purposes other than spatial analysis, such as:
The most important third-party packages for spatial analysis in Python, which we are going to cover in detail, are listed in order of appearance in Table 1. The package version being used when compiling the book is also specified.
Package |
Version |
Functionality |
Website |
|---|---|---|---|
|
|
Arrays |
|
|
|
Tables |
|
|
|
Vector geometries |
|
|
|
Vector layers |
|
|
|
Rasters |
As we will see, these packages depend on one another. The major dependencies are depicted in Fig. 5.

Fig. 5 Main dependencies between the Python packages we are going to learn#
Additionally, we are going to use the packages listed in Table 2 for specific tasks.
Package |
Version |
Functionality |
Website |
|---|---|---|---|
|
Working with CSV files |
||
|
Mathematical functions |
||
|
|
Plots |
|
|
File search by pattern |
||
|
|
Zonal statistics |
|
|
|
Topographic raster calculations |
|
|
|
Focal filtering |
Sample data#
Throughout the book, we are going to use several datasets for demonstrating the methods we learn. The data can be downloaded from one of the following links:
Table 3 lists the datasets used in the book.
Dataset |
Filename |
Format |
Accessed |
Source |
|---|---|---|---|---|
Python script |
|
Python |
2022 |
- |
“Requirements” file |
|
TXT |
2021 |
- |
World cities |
|
CSV |
2021 |
R package |
Carmel DEM |
|
CSV |
2016 |
SRTM data, from https://earthexplorer.usgs.gov/ |
Carmel DEM (low resolution) |
|
CSV |
2016 |
SRTM data, from https://earthexplorer.usgs.gov/ |
Kinneret water level |
|
CSV |
2021 |
Water authority https://data.gov.il/dataset/https-www-data-gov-il-dataset-682 |
GISS global temperature |
|
CSV |
2022 |
|
University students |
|
CSV |
2021 |
|
GTFS |
|
CSV |
2021 |
https://www.gov.il/he/departments/general/gtfs_general_transit_feed_specifications |
BGU logo |
|
WKT |
2021 |
|
Railway stations |
|
Shapefile |
2020 |
Ministry of Transport https://data.gov.il/dataset/rail_stat_onoff_month |
Railway lines |
|
Shapefile |
2020 |
Ministry of Transport https://data.gov.il/dataset/rail_strategic |
Israel municipalities |
|
Shapefile |
2022 |
Ministry of Interior https://www.gov.il/he/departments/guides/info-gis |
Statistical areas demography 2019 |
|
Geodatabase |
2019 |
|
Beer-Sheva aerial photo (2015) |
|
GeoTIFF |
2021 |
|
Sentinel2 image |
|
JPEG2000 |
2020 |
Sentinel2, from https://earthexplorer.usgs.gov/ |
In some code examples in the book we are also going to create new files, to be used in later chapters or to demonstrate file export using Python. You can create them on your own, by running the code examples. Alternatively, you can download them from the following link:
Table 4 lists the files that we are going to create in the book.
Dataset |
Filename |
Format |
Chapter |
|---|---|---|---|
World cities |
|
Shapefile |
|
Railway stations |
|
CSV |
|
Public transit routes |
|
Shapefile |
|
Public transit routes |
|
GeoJSON |
|
Public transit routes |
|
GeoPackage |
|
Carmel DEM |
|
GeoTIFF |
|
Sentinel-2 stacked image |
|
GeoTIFF |
|
Carmel topographic aspect |
|
GeoTIFF |
Recommended materials online#
Overview#
This section contains links to recommended online resources which are relevant to the scope of this book. All of the listed resources are freely available online.
Official tutorials#
The official tutorials of the third-party packages are often the best place to start. Go to the home pages of the main packages we are going to learn (Table 1) to find the official tutorials of those packages.
Courses#
Courses on general Python:
Courses on geospatial Python:
PyGIS - Open Source Geospatial Programming & Remote Sensing (The George Washington University)
Spatial data science for sustainable development (Aalto University)
Geospatial Analysis and Representation for Data Science (University of Trento)
Foundations of Spatial Data Science (University College London)
Tutorials#
Tutorials on general Python:
Data Analysis and Visualization with Python for Social Scientists (Data Carpentry)
Data Analysis and Visualization in Python for Ecologists (Data Carpentry)
Tutorials on geospatial Python:
Mapping and Data Visualization with Python (SpatialThoughts)
Introduction to Geospatial Raster and Vector Data with Python (Data Carpentry)
Python tutorials on related topics:
Books#
Books on general Python:
Books on geospatial Python:
References#
- BPGomezR13
Roger S Bivand, Edzer J Pebesma, and Virgilio Gómez-Rubio. Applied spatial data analysis with R. Springer, 2013.
- Gar16
Chris Garrard. Geoprocessing with Python. Manning Publications, 2016.
- LNM19
Robin Lovelace, Jakub Nowosad, and Jannes Muenchow. Geocomputation with R. CRC Press, 2019.
- Van16
Jake VanderPlas. Python data science handbook: Essential tools for working with data. O'Reilly Media, 2016.
- 1
https://insights.stackoverflow.com/survey/2021#most-popular-technologies-language
- 2
The GTFS dataset is composed of several
.txtfiles (located in thegtfsfolder), namely:agency.txt,calendar.txt,fare_attributes.txt,fare_rules.txt,routes.txt,shapes.txt,stops.txt,stop_times.txt,translations.txt,trips.txt.- 3
By convention, Shapefile datasets are listed as
.shpfiles. However, a Shapefile is actually composed of at least two more files (.shx,.dbf), and usually more, sharing the same prefix.