Chapter 7 GeoJSON
Last updated: 2018-11-11 20:44:59
7.1 What is GeoJSON?
GeoJSON is an plain text format designed for representing vector geometries, with or without non-spatial attributes, based on the JavaScript Object Notation (JSON). We briefly introduced the GeoJSON format in Section 3.10.2. This Chapter is devoted to more in-depth treatment of the format and its usage in web maps.
GeoJSON is becoming a very popular data format in many GIS technologies and services related to web mapping. It is actually the standard format for passing spatial vector layer data between the client and the server in web applications. As mentioned in Section 3.10.2, the main reason for its popularity is the fact that GeoJSON is a special case of JSON, which means that it can be easily parsed and processed with JavaScript. As a result, GeoJSON is the best (sometimes even the only) supported format by JavaScript web mapping libraries and platforms, such as Leaflet (Chapter 6), CARTO (Chapter 9) and Turf.js (Chapter 12) which we learn about in this book.
Other advantages of GeoJSON are that it is simple and human-readable, being a plain-text format. A disadvantage of GeoJSON is that its file size can get relatively large compared to other formats such as a Shapefile. However, there are solutions for reducing GeoJSON file size such as simplifying its geometry, which we will learn about in this Chapter (Section 7.3.2).
In this Chapter, we learn about how the GeoJSON format is structured, how we can to create GeoJSON instances and edit them, and how we can add GeoJSON layers on a Leaflet map. Keep in mind that, for simplicity, we will use the term GeoJSON interchangeably referring to both the original GeoJSON string as well as the parsed object derived from the string. Mapping library documentation often also uses the term GeoJSON for both. Keep in mind that, strictly speaking, GeoJSON refers just to text string instances, not to their derived JavaScript objects (see Section 3.10).
7.2 GeoJSON structure
7.2.1 Overview
In this section, we will briefly introduce the different types of GeoJSON strings you may encounter when working with this format. If you are new to JSON and GeoJSON it may seems difficult to grasp the exact syntax and structure of the format right from the start. Don’t worry - we will come back to more examples later on in this Chapter, as well as in the subsequent Chapters. Moreover, rest assured one is almost never required to type GeoJSON strings by hand. One generally uses pre-existing GeoJSON, exported from existing layers in other formats using GIS software, or coming from external web resources and databases. As we will see in the Section 7.3, you can create and edit GeoJSON even without GIS software, using a web interface called geojson.io. That said, it is important to be familiar with the general structure of GeoJSON to recognize what type of layer you have at hand, and how to extract meaningful information from it.
GeoJSON is a format for representing Simple Feature geometries, possibly along with their non-spatial attributes. The Simple Features standard defines 20+ types of geometry types, and the Well-Known Text (WKT) format for representing them. We will come back to WKT in Chapter 9 when discussing spatial databases.
GeoJSON supports just the seven most commonly used Simple Feature geometry types (Figure 7.1). Having non-spatial attributes is not required for valid GeoJSON, so the seven geometries alone are encountered when representing the shapes alone. In case non-spatial attributes are present, their combination with a geometry forms a Feature. Finally, a collection of more than one features forms a "FeatureCollection". The "FeatureCollection" GeoJSON type corresponds to the meaning of a “layer” we are familiar with from GIS software (e.g. in a Shapefile).
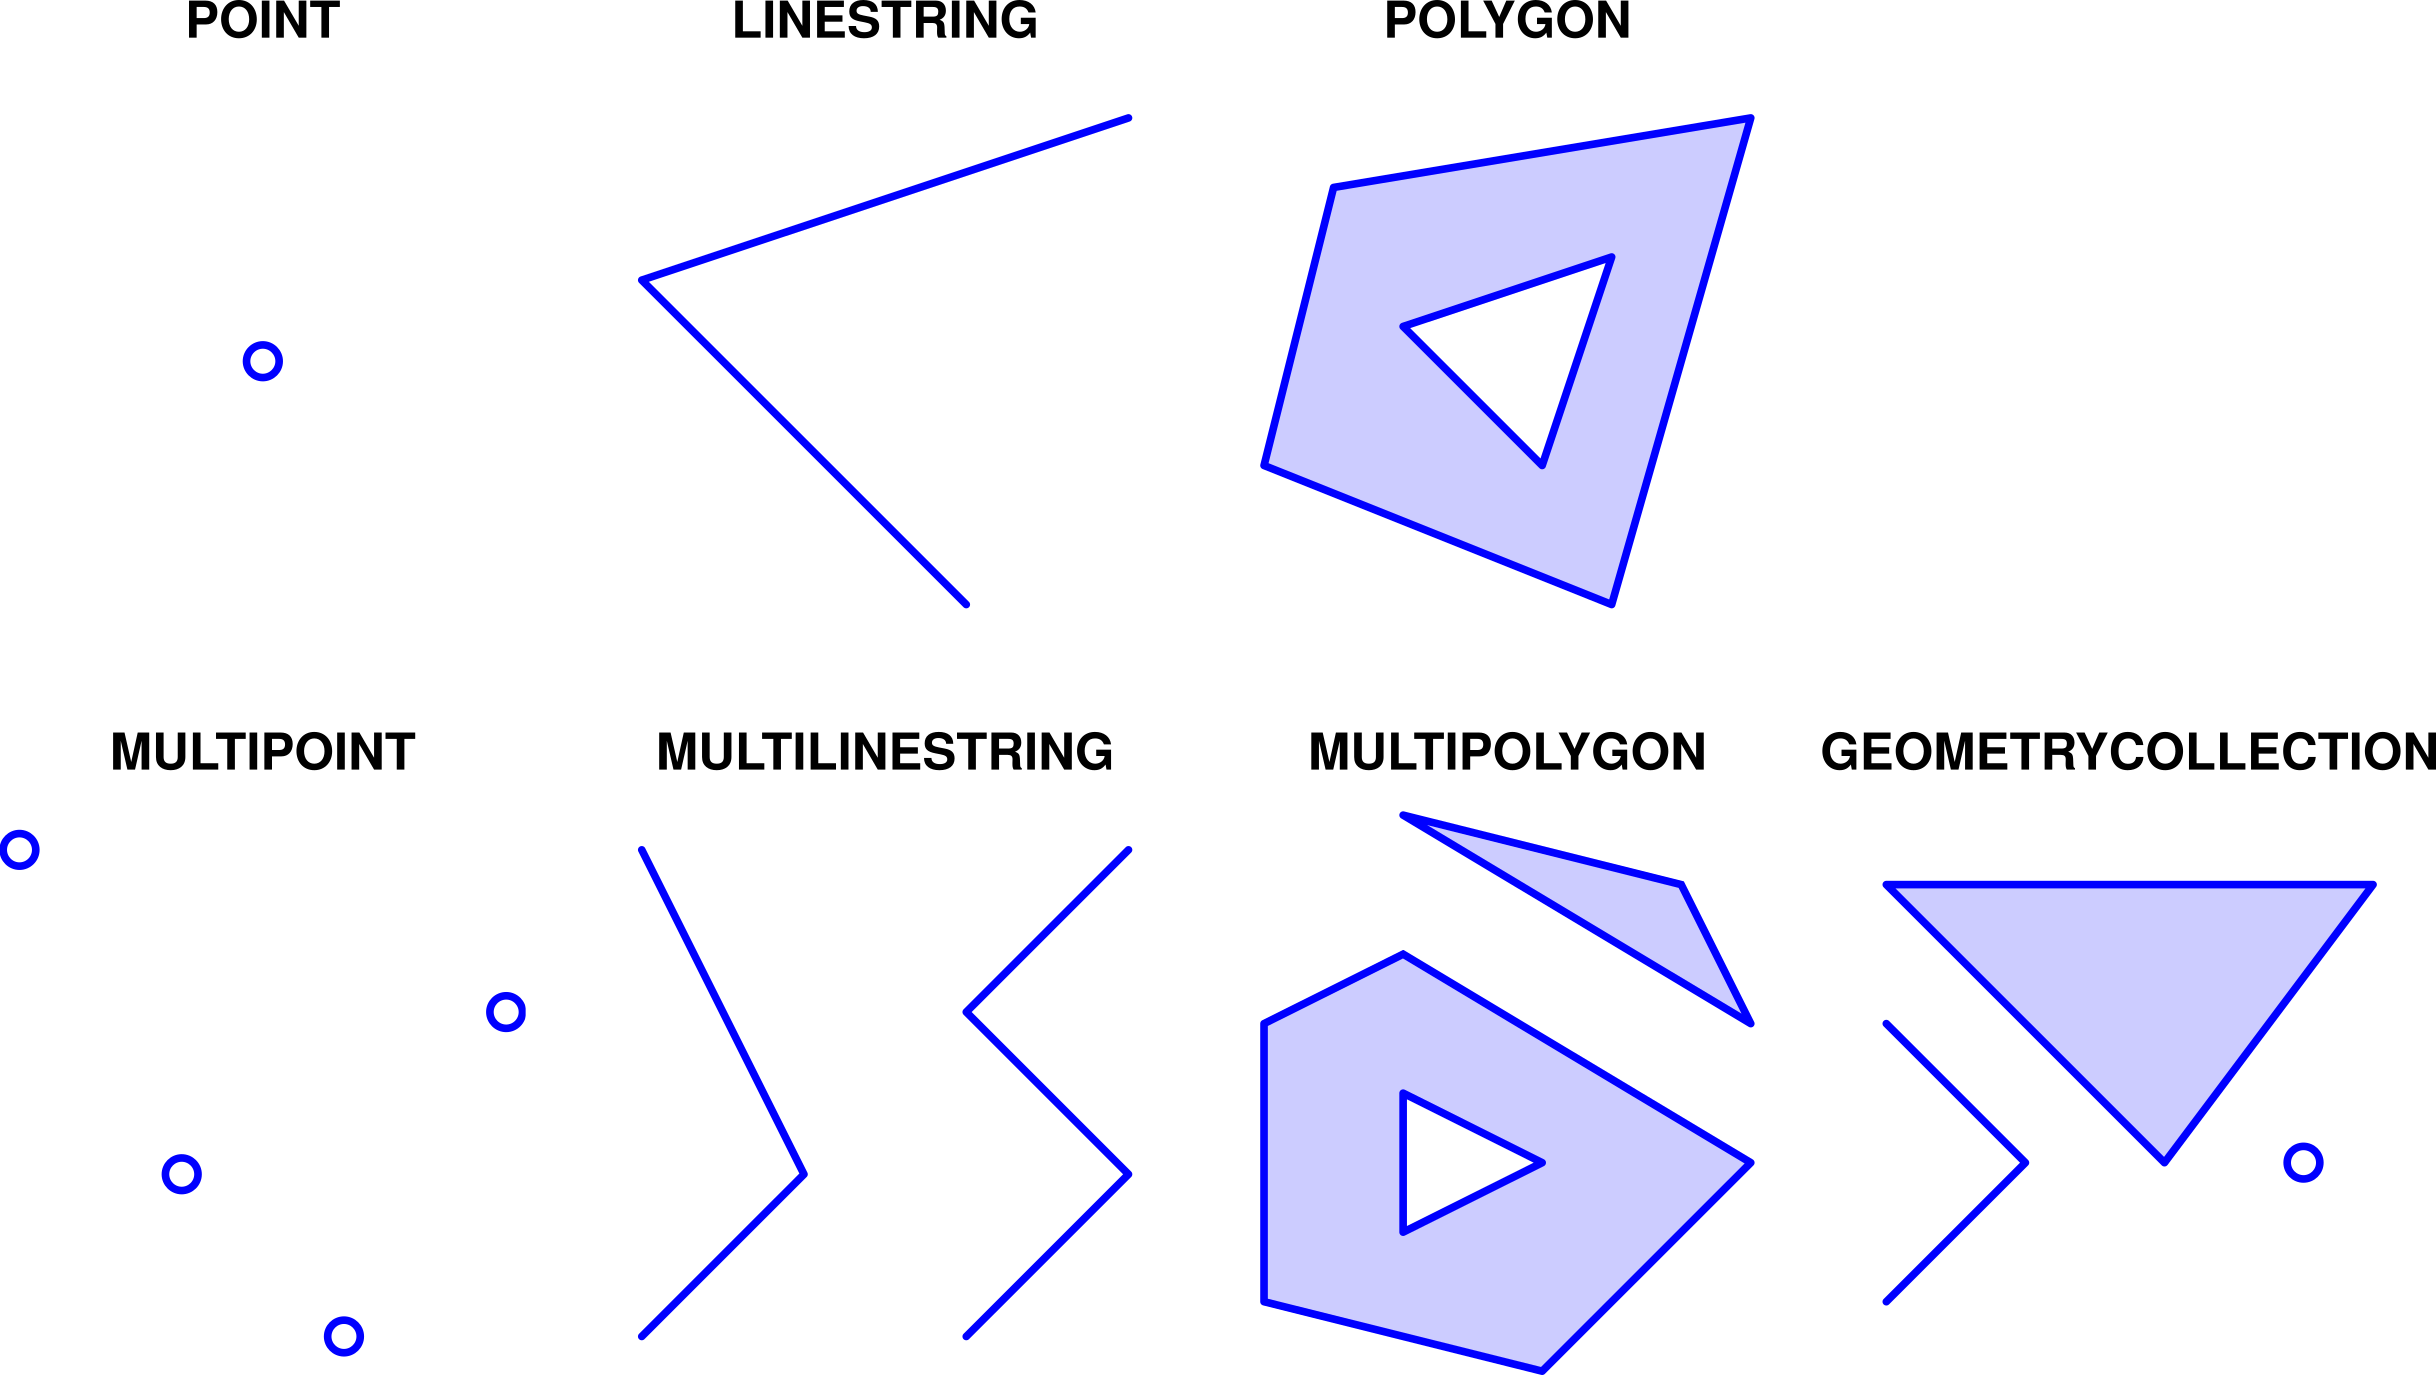
FIGURE 7.1: Seven Simple Feature geometry types supported by the GeoJSON format
To repeat the above, the hierarchy of GeoJSON types includes nine types which can be group into three “levels” of complexity -
- Geometry - One of the seven most common Simple Feature geometry types, such as
"MultiPolygon"(see below and Figure 7.1) "Feature"- A feature, i.e. a geometry along with its non-spatial attributes"FeatureCollection"- A collection of features
GeoJSON supports the following seven geometry types -
"Point"- A single point"LineString"- Sequence of connected points forming a line"Polygon"- Sequence of connected points “closed” to form a polygon, possibly having one or more holes"MultiPoint"- Set of points"MultiLineString"- Set of lines"MultiPolygon"- Set of polygons"GeometryCollection"- Set of geometries of any type exceptGeometryCollection
A "Feature" in GeoJSON contains a geometry object and additional, non-spatial, properties also known as attributes. Finally, a "FeatureCollection" represents a collection of features.
The following sections demonstrates the formatting of GeoJSON strings from the nine above-mentioned GeoJSON types -
7.2.2 Geometries
7.2.2.1 General structure
A GeoJSON string for representing either of the first six geometry types is composed of two properties -
"type"- The geometry type (a string)"coordinates"- The coordinates (an array)
For example -
{
  "type": "Point",
  "coordinates": [30, 10]
}
The seventh geometry type, "GeometryCollection", has a slightly different structure (Section 7.2.2.4 below).
The "type" property value can be one of the following strings: "Point", "LineString", "Polygon", "MultiPoint", "MultiLineString", "MultiPolygon" and "GeometryCollection".
The "coordinates" property is specified with an array. The basic unit of the coordinate array is the point coordinate. According to the GeoJSON specification, point coordinates should refer to two-dimensional locations in geographical units of longitude and latitude (ESPG:4326), i.e. [lon, lat]. Again, remember that in Leaflet the convention is to specify point coordinates the opposite way, as [lat, lon] (Section 6.5.4). A nice blog post by Tom MacWright gives a list of different mapping software using each of the [lon, lat] and [lat, lon] conventions. Point coordinates in GeoJSON can also have three dimensions (i.e. 3D), though this is less useful in web mapping and we will not see such examples in the book.
The basic point coordinate can be used on its own (for "Point", as shown in the above GeoJSON example), or as a component in higher hierarchical level arrays (for the six other geometry types, see below).
Now that we covered the things that are common to the seven GeoJSON geometry types, we focus on the specifics of each. Overall, the seven geometry types can be conceptually divided into three groups, based on their complexity -
"Point","LineString","Polygon"- Single-part geometries, where the geometry consists of a single shape of one type (Section 7.2.2.2)"MultiPoint","MultiLineString","MultiPolygon"- Multi-part geometries, where the geometry consists of any number of shapes of the same type (Section 7.2.2.3)"GeometryCollection"- Geometry collections, where the geometry can consist of any number of shapes of any type (Section 7.2.2.4)
7.2.2.2 Single-part geometries
For single-part geometry types, coordinates are specified as follows -
"Point"coordinates are specified with a single point coordinate (e.g.[30, 10])"LineString"coordinates are specified with an array of point coordinates (e.g.[[30, 10], [10, 30], [40, 40]])"Polygon"coordinates are specified with an array of arrays of point coordinates, where the each array of point coordinates specifies the exterior border ring (first array), or polygon holes (all other arrays, if any). Also, the last coordinate in each set is equal to the first one to form a closed ring (e.g.[[[30, 10], [40, 40], [20, 40], [10, 20], [30, 10]]])
Note that we have increasing number of hierarchical levels in the coordinates array for these three geometry types -
- A
"Point"has one level[...] - A
"LineString"has two levels[[...]] - A
"Polygon"has three levels[[[...]]]
Table 7.1 shows several examples of single-part geometry types, including two varieties of "Polygon" geometries: with holes and without holes.
| Type | Examples | |
|---|---|---|
Point
|

|
|
LineString
|

|
|
Polygon
|

|
|

|
||
7.2.2.3 Multi-part geometries
Multi-part geometry types are similar to their single-part counterparts. The only difference is that one more hierarchical level is added into the coordinates array, for specifying multiple shapes.
Therefore -
- A
"MultiPoint"has two levels[[...]] - A
"MultiLineString"has three levels[[[...]]] - A
"MultiPolygon"has four levels[[[[...]]]]
For example, a "MultiLineString" consists of an array of arrays of arrays, or an array of "LineString" coordinates, for defining several line parts, as in [[[10, 10], [20, 20], [10, 40]], [[40, 40], [30, 30], [40, 20], [30, 10]]].
Table 7.2 gives examples of multi-part geometry types.
| Type | Examples | |
|---|---|---|
MultiPoint
|

|
|
MultiLineString
|

|
|
MultiPolygon
|

|
|

|
||
7.2.2.4 Geometry collections
A geometry collection is a set of several geometries, where each geometry is one of the above six types, i.e. any geometry type excluding "GeometryCollection".
For example, a "GeometryCollection" consisting of two geometries, a "Point" and a "MultiLineString", can be defined as follows -
{
"type": "GeometryCollection",
"geometries": [
{
"type": "Point",
"coordinates": [...]
},
{
"type": "MultiLineString",
"coordinates": [...]
}
]
}Where [...] are the coordinate arrays for each geometry.
It is harder to deal with geometry collections when applying spatial operators, because not every operator (Section 9.6.4) has the same meaning (if any) for all geometry types. For example, calculating line length is only meaningful for a "MultiLineString" geometry, but not for a "Point" geometry. For this reason geometry collections are rarely encountered in practice, and we will not use them in this book.
Table 7.3 shows an example of a geometry collection GeoJSON string.
| Type | Examples | |
|---|---|---|
GeometryCollection |

|
|
7.2.3 Features
A "Feature" is formed when a geometry is combined with non-spatial attributes, to form a single object. The non-spatial attributes are provided in a property named "properties", containing the name-value pairs per attribute.
For example, the following "Feature" represents a geometry with two attributes, named "color" and "area" -
{
"type": "Feature",
"geometry": {...},
"properties": {
"color": "red",
"area": 3272386
}
}Where {...} represents a geometry object, i.e. one of the seven types shown above.
Table 7.4 shows an example of a GeoJSON feature.
| Type | Examples | |
|---|---|---|
Feature
|

|
|
7.2.4 Feature collections
A "FeatureCollection" is, like the name suggests, a collection of "Feature" objects. The separate features are contained in an array, comprising the "features" property. For example, a "FeatureCollection" composed of four features can be specified as follows -
{
"type": "FeatureCollection",
"features": [
{...},
{...},
{...},
{...}
]
}Where {...} represents a "Feature".
If you are coming from GIS background, the "FeatureCollection" GeoJSON type will seem the most natural one. For example, in the terminology of the Shapefile, the most commonly used format for vector layers in GIS software, a "FeatureCollection" is analogous to a layer with more than one feature and one or more attributes - which is by far the most commonly encountered case. A "Feature" is analogous to a layer containing a single feature, which is rarely encountered. Bare GeoJSON geometries, such as "Point" or "MultiPolygon", have no analogs in the Shapefile format and thus cannot be converted to a Shapefile.
One more thing that may seem surprising for GIS software users is that a "FeatureCollection" does not have to be composed of features with the same type of geometry. For instance, in the above schematic GeoJSON "FeatureCollection", the first two {...} features may have "Point" geometry while to other two {...} features can have "Polygon" geometry. This kind of flexibility is also not supported in the Shapefile format, where all of the features must be of the same geometry type.
Table 7.5 shows an example of a GeoJSON feature.

For more information, the More than you ever wanted to know about GeoJSON blog post is a recommended read. The complete specification of the GeoJSON format can be found on the official website of the standard.
7.3 Editing GeoJSON
7.3.1 geojson.io
The geojson.io web application is great way to explore the GeoJSON format. This website contains an interactive map and a drawing control that you can use to draw new vector layers, and to edit drawn ones. The GeoJSON string for the drawn content is displayed beside the map, and is automatically synchronized with the currently drawn shapes while you are editing (Figure 7.2).
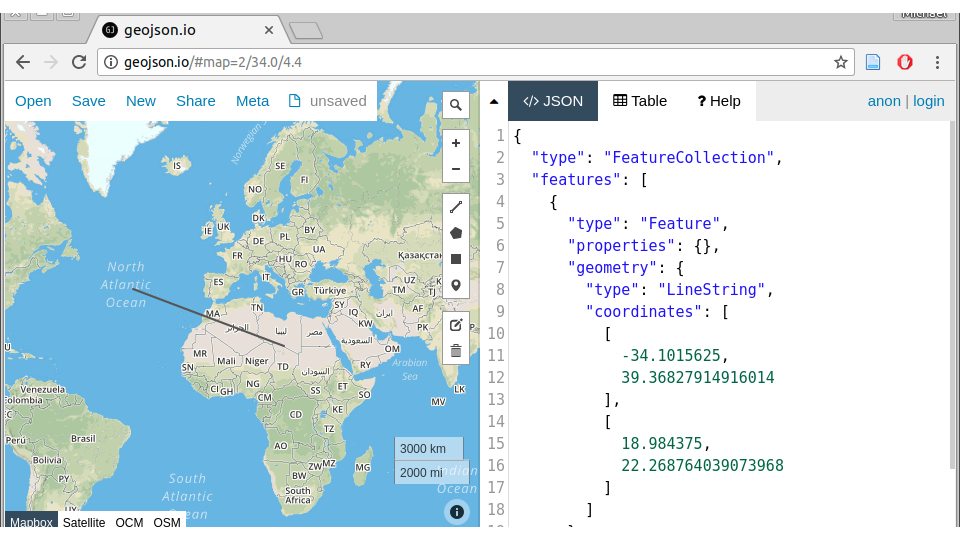
FIGURE 7.2: The geojson.io web application
- Browse to http://geojson.io
- Paste one of the GeoJSON object examples from the above table into the right-side panel
- You should see the shapes displayed on the left-side map panel
- Use the drawing controls on the right of the map panel to draw some shapes on the map
- You should see the GeoJSON string for the layer you created on the right-side text panel
To understand a little better how web applications such as http://geojson.io work, we will shortly create our own (partial) version of such an application using Leaflet and jQuery (Section 7.5).
7.3.2 mapshaper
In our introduction of the GeoJSON format (Section 7.1), we mentioned that a major disadvantage of this format is large file size. This is an especially painful limitation in web mapping, where we are limited by internet connection bandwidth and by browser processing capabilities. Displaying very large GeoJSON in a web map can result in bad user experience, since the web map will take a long time to load and will not be very responsive.
Plainly speaking, GeoJSON size can get large when we have one or more of the following -
- A lot of features
- A lot of attributes
- Highly complex geometry
The first two are trivial to optimize: we just need to delete any non-essential features and attributes, keeping only the information actually displayed on the map. The third is more tricky, since it requires some kind of simplification algorithm, determining which coordinates to delete and which ones to keep. For example, the Douglas–Peucker algorithm is a well known geometry simplification algorithm, implemented in numerous GIS software.
mapshaper is currently one of the best tools for the simplification task. It is a free and open-source software with several geometry-editing functions, though it is best known for fast and easy simplification of vector layers. Importantly, mapshaper performs topologically-aware polygon simplification. This means that shared boundaries between adjacent polygons are always kept intact, with no gaps or overlaps, even at high levels of simplification.
mapshaper comes in two versions - a command-line tool and an interactive web interface (Figure 7.3).
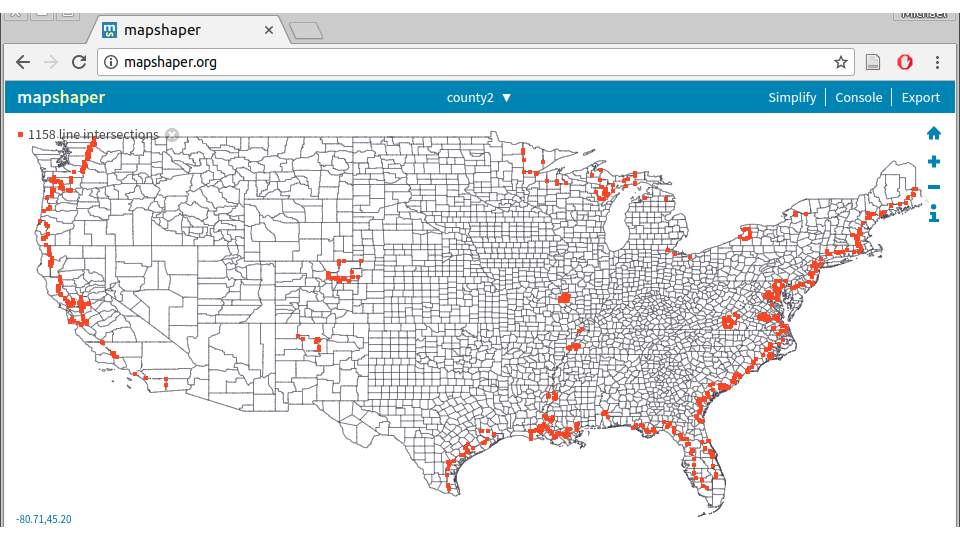
FIGURE 7.3: The mapshaper.org web application
Take a moment to try mapshaper’s web interface in the following exercise.
- Download a polygonal layer of US counties (or obtain any other detailed polygonal Shapefile, from the web or from elsewhere). The US counties layer is very large (66.5 MB), and has some topological errors. We are going to fix the errors, then simplify the layer to optimize its usage in web maps, using mapshaper
- Drag and drop the file into the http://mapshaper.org/ main screen, or use the Select button, then click Import
- The red dots you see (Figure 7.3) are line intersections, which are considered topological errors. To fix these, re-import the file, this time selecting the snap vertices option. There should be no red dots on the map now, since all line intersections have been fixed
- Click the simplify button on the upper-right corner, then click Apply
- Use the slider on the top of the page to simplify the layer. Zoom-in on coastal areas with lots of details (such as in Florida) to observe the degree of simplification process more clearly
- After choosing a level of simplification you are happy with, click Export, choose the GeoJSON format, then click Export once more. The simplified layer should be downloaded. Check the size of the new file, which should be reduced according to the level of simplification you chose
7.3.3 Formatting JSON
The above examples are nicely formatted in a way that makes reading them easier.
For example -
{
  "type": "Polygon",
  "coordinates": [
      [[35, 10], [45, 45], [15, 40], [10, 20], [35, 10]],
      [[20, 30], [35, 35], [30, 20], [20, 30]]
  ]
}But what if you got the above GeoJSON from a database, where it is kept with no spaces or line breaks, like so -
{"type":"Polygon","coordinates":[[[35,10],[45,45],[15,40],...This is a small example, but imagine a large "FeatureCollection", with the entire GeoJSON string in a single line!
There are numerous tools and websites for automatically formatting JSON text strings that can be used in such case. Formatting adds spaces and new-lines so that it is once again easier to understand object structure.
Here are two examples you can check out -
Alternatively, you can always process the GeoJSON with JSON.parse (assuming it is correctly formatted and can be parsed), then examine the resulting object structure in the console.
7.4 Adding GeoJSON to Leaflet map
Below is an example of a GeoJSON string. This particular layer is a "FeatureCollection". It contains two features of type "Polygon", representing the borders of two states in the US. You can tell the polygons are quadrilateral (i.e., have four edges) by the fact that each of them is defined with five coordinate pairs (recall that the last coordinate is equal to the first, to form a closed shape; see Section 7.2.2.2). Each polygon has one attribute named "party", with one of the polygons having the value "Republican" and the other polygon having the value "Democrat".
{
  "type": "FeatureCollection",
  "features": [
    {
      "type": "Feature",
      "properties": {"party": "Republican"},
      "geometry": {
          "type": "Polygon",
          "coordinates": [
              [[-104.05, 48.99], [-97.22,  48.98],
              [-96.58,  45.94], [-104.03, 45.94],
              [-104.05, 48.99]]
          ]
      }
    },
    {
      "type": "Feature",
      "properties": {"party": "Democrat"},
      "geometry": {
          "type": "Polygon",
          "coordinates": [
              [[-109.05, 41.00], [-102.06, 40.99],
              [-102.03, 36.99], [-109.04, 36.99],
              [-109.05, 41.00]]
          ]
      }
    }
  ]
}
- Open the console and define a variable named
xwith the above object- Type
x.features[1].geometry.coordinates[0][1][1]- What is the meaning of the number you got?
How can we add the above GeoJSON layer to a Leaflet map? We will start with the basic map in example-06-02.html (Figure 6.5) from Section 6.5, and make changes on top of it.
Before we begin, let’s focus our map on the US area and reduce the zoom level, so that our polygons will be visible on the initial map extent -
var map = L.map("map").setView([43, -105], 4);We are using the setView method instead of the L.map option like we did in the basic map example (Section 6.5.6) -
var map = L.map("map", {center: [43, -105], zoom: 4});In the present example both approaches are interchangeable. However, the setView method offers more flexibility, since we can use it to dynamically modify our map viewed extent, after the map is already created. Therefore it is useful to be familiar with both.
- Open the
example-07-01.html(below) in the browser- Run the expression
map.setView([20, -90], 5);in the console- What has happened?
Also, for the sake of diversity, let’s replace the OpenStreetMap base layer with a different one, called CartoDB.PositronNoLabels. The code shown below was copied from the Leaflet-providers website which was introduced in Section 6.5.7.
L.tileLayer("https://cartodb-basemaps-{s}.global.s[...].png", {
attribution: '© <a href="http://www.openstr[...]</a>',
subdomains: "abcd",
maxZoom: 19
}).addTo(map);(Parts of the URLs were omitted and marked by [...] to save space)
Now that we have a basic map with a tile layer focused on the US, let’s add the GeoJSON layer. First, we will create a variable named states, and assign the above GeoJSON object to that variable -
var states = {
  "type": "FeatureCollection",
  ...
}
(We omit most of the GeoJSON string to save space)
Note that we are using the brackets notation {} to create the respective object out of the GeoJSON string right away, rather than entering it as text and using JSON.parse (Section 3.10.2).
Second, we will use the L.geoJSON function, to add a GeoJSON layer to our map. The function accepts an GeoJSON object, and transforms it to a Leaflet layer object. The layer can then be added on the map using its addTo method, the same way we added tile layers, and simple point, line polygon shapes in Chapter 6.
In our case, the expression takes the following form -
L.geoJSON(states).addTo(map);After these two expressions are added into our script, the resulting map (example-07-01.html) displays the GeoJSON polygons on top of the tile layer, as shown on Figure 7.4.
FIGURE 7.4: example-07-01.html (Click to view this example on its own)
Note that the GeoJSON layer is added with the default style. In Chapter 8 we will learn how to set our own style, either the same way for all features (Section 8.3), or differently depending on attributes (Section 8.4) or events (Section 8.8.1).
Also, keep in mind that by default Leaflet expects WGS84 coordinates (i.e. [lon, lat]), which we have in the GeoJSON for this example as well as all other example in the book. As mentioned in Section 7.2.2.1, GeoJSON with coordinates given in other Coordinate Reference Systems (CRS) in disagreement with the GeoJSON specification, thus more rarely encountered and less practical to use with Leaflet. For example, using non-WGS84 GeoJSON layers requires setting the entire map in a different CRS, which means that the standard tile layers cannot be loaded, as they are tailored for the WGS84 system. Unless there is some special reason to display the web map a non-WGS84 CRS, in most cases it is more reasonable to just reproject the GeoJSON to WGS84 before using it with Leaflet.
7.5 GeoJSON viewer
Earlier in this Chapter (Section 7.3.1), we used the geojson.io web application to interactively view and edit GeoJSON. In this section, we are going to recreate a (very simplified) GeoJSON viewer of our own. While doing it, we will learn some more about using GeoJSON with Leaflet.
Like geojson.io, the interface of our GeoJSON viewer will have two parts -
- An interactive map
- A text editing area
Below the text editing area we will have a submit button. Pressing on the button will display the GeoJSON string currently typed into the text area on the interactive map (Figure 7.5).
7.5.1 HTML and CSS
Once again, we start with the basic map template from Section 6.5.6, modifying and adding further components on top of it.
First of all, instead of having a full screen map <div id="map">, we set the HTML code for the two parts of our page, specified with two <div> elements -
<div id="map">- The map<div id="text">- The text input area
<div id="map"></div>
<div id="text">
    <textarea id="geojsontext"></textarea>
    <input type="button" id="submit" value="Submit">
</div>
Note that the text input <div> is composed of two separate elements, <textarea> (Section 1.5.12.4) and <input type="button"> (Section 1.5.12.8). The <textarea> element is similar to <input type="text"> (Section 1.5.12.3), but intended for multi-line rather than single-line text input.
Next, we need some CSS to control the appearance and arrangement of these HTML elements -
#map {
    width: 60%;
    height: 100%;
    float: left;
}
#text {
    height: 100%;
    width: 40%;
    float: right;
}
#geojsontext {
    display: block;
    margin-left: auto;
    margin-right: auto;
    margin-top: 20px;
    width: 90%;
    height: 80%;
}
#submit {
    margin: 20px;
}
html, body {
    height: 100%;
    margin: 0;
    padding: 0;
}
First thing to note in the CSS code is that the map takes 60% of the screen width, while the text area takes 40%, as specified using the respective width properties. We are also using the float CSS property (which we haven’t met so far), to specify that an element should be placed along the left or right side of its container. This places the map and the text entry <div> elements side by-side, rather than one on top of the other.
We also need to load the jQuery library (Section 4.4), by placing the following element in the <head>.
<script src="js/jquery.js"></script>The jQuery library is needed since we are going to use jQuery methods to get the currently entered text in the text area and for binding an event listener (Section 7.5.3 below).
7.5.2 Base map
Next, inside the <script>, we fill the map <div> with a Leaflet map, including a tile layer, just like we did earlier in example-07-01.html -
var map = L.map("map").setView([0, 0], 1);
L.tileLayer('https://cartodb-basemaps-{s}.global.s[...].png', {
attribution: '© <a href="http://www.openstr[...]</a>',
subdomains: 'abcd',
maxZoom: 19
}).addTo(map);(Again, part of the URLs was omitted and marked by [...] to save space)
Note that we center the map to [0, 0] at zoom level 1. That way, the map initially displays a global extent (Figure 7.5).
7.5.3 Adding an event listener
All of the page elements are now in place: the map, the text area and the submit button. What’s missing is the association between the text area and the map. To define it, we bind an event listener to the submit button. The showGeojson function (see below) is going to collect the current value of the text area, and display the corresponding GeoJSON layer on the map with L.geoJSON. As we have seen in Section 7.4, L.geoJSON actually expects a parsed object, which is why the text string extracted from the <textarea> input needs to be parsed with JSON.parse before being passed to L.geoJSON.
Here is the definition of the showGeojson function and the event listener -
function showGeojson() {
    var txt = $("#geojsontext").val();
    txt = JSON.parse(txt);
    L.geoJSON(txt).addTo(map);
}
$("#submit").on("click", showGeojson);
The event listener responds to "click" events on the "#submit" button. Each time the button is clicked, the current value of the "#geojsontext" text area is parsed and displayed on the map.
7.5.4 Using layer groups
One problem with the above code is that if we submit two (or more) different layers, they are sequentially added one on top of the other, on the same map. This can be inconvenient for the user, as previously entered layers will obstruct the new ones. We need some kind of mechanism to remove all previous layers before a new layer is loaded when pressing submit.
A convenient way of achieving this effects is to use a layer group. A layer group, in Leaflet terminology, is a collection of layers conveniently associated with a single variable. That way, we can apply the same action on all of the layers at once, as a single unit.
An empty layer group can be created with L.layerGroup(), and added to the map with its .addTo method. For example, when setting up our initial map we can create a layer group named layers, an add it to our map, as follows -
var layers = L.layerGroup().addTo(map);Adding an empty layer group to a map has no visible effect. However, any layer we add to that group, later on, will be automatically displayed on the map.
At this stage our map will contain a tile layer and an (empty) layer group. To add a GeoJSON layer to our layer group, and thus display it on the map, we simply replace map with layers, so that the following expression -
L.geoJSON(txt).addTo(map);Now becomes -
L.geoJSON(txt).addTo(layers);The advantage of the new approach is that a layer group can be cleared, using the .clearLayers method -
layers.clearLayers();Clearing a layer group removes all layers which it previously contained, so that it the layer group returns to its initial (empty) state. This means the layers are also removed from any map where the layer group was added on.
Using the layer group approach, our modified showGeojson function is shown below. Now, each time the submit button is pressed all earlier GeoJSON content is removed from the map before the new content is shown.
function showGeojson() {
    layers.clearLayers();                // Remove old GeoJSON
    var txt = $("#geojsontext").val();
    txt = JSON.parse(txt);
    L.geoJSON(txt).addTo(layers);        // Display new GeoJSON
}
The resulting GeoJSON viewer application (example-07-02.html) is shown on Figure 7.5.
FIGURE 7.5: example-07-02.html (Click to view this example on its own)
- Open
example-07-02.htmlin the browser- Try copying and pasting some of the GeoJSON examples we saw earlier to test the GeoJSON viewer!
A Layer Group can also be used for adding controls for toggling layer visibility. See the Layer Groups and Layers Control Tutorial for details.
7.6 Ajax
7.6.1 Overview
In the early days of the internet, up to mid-1990s, most websites were based on complete or static HTML pages served with a static web server (Section 5.4.2). Consequently, each user action required that a complete new page was loaded from the server. In many cases, this process is very inefficient and makes a bad user experience, as the entire page contents disappear and then the new page appears, even if just part of the page needs to be updated.
Nowadays, many modern websites use a set of techniques called Asynchronous JavaScript and XML (Ajax) to partially update the contents of web pages. With Ajax, the web page can send data to, and retrieve from, a server without interfering with the current state of the page or requiring page reload (Figure 7.6). That way, Ajax allows for web pages to change content dynamically without the need to reload the entire page. This makes the website feels more responsive.

FIGURE 7.6: Schematic illustration of the difference between the traditional and Ajax request models
Ajax uses an asynchronous processing model. This means the user can do other things while the web browser is waiting for the data to load, speeding up the user experience. The term asynchronous refers to the fact that loading data via Ajax does not stop the rest of the content from being loaded. Instead, the Ajax request is being sent to the server and in the interval before the server responds the rest of the page continues to load (Figure 7.7). When the response arrives, the content is processed. This is in contrast to the regular synchronious behavior of scripts, where the browser typically stops processing the page while executing each of the expressions in the <script>.
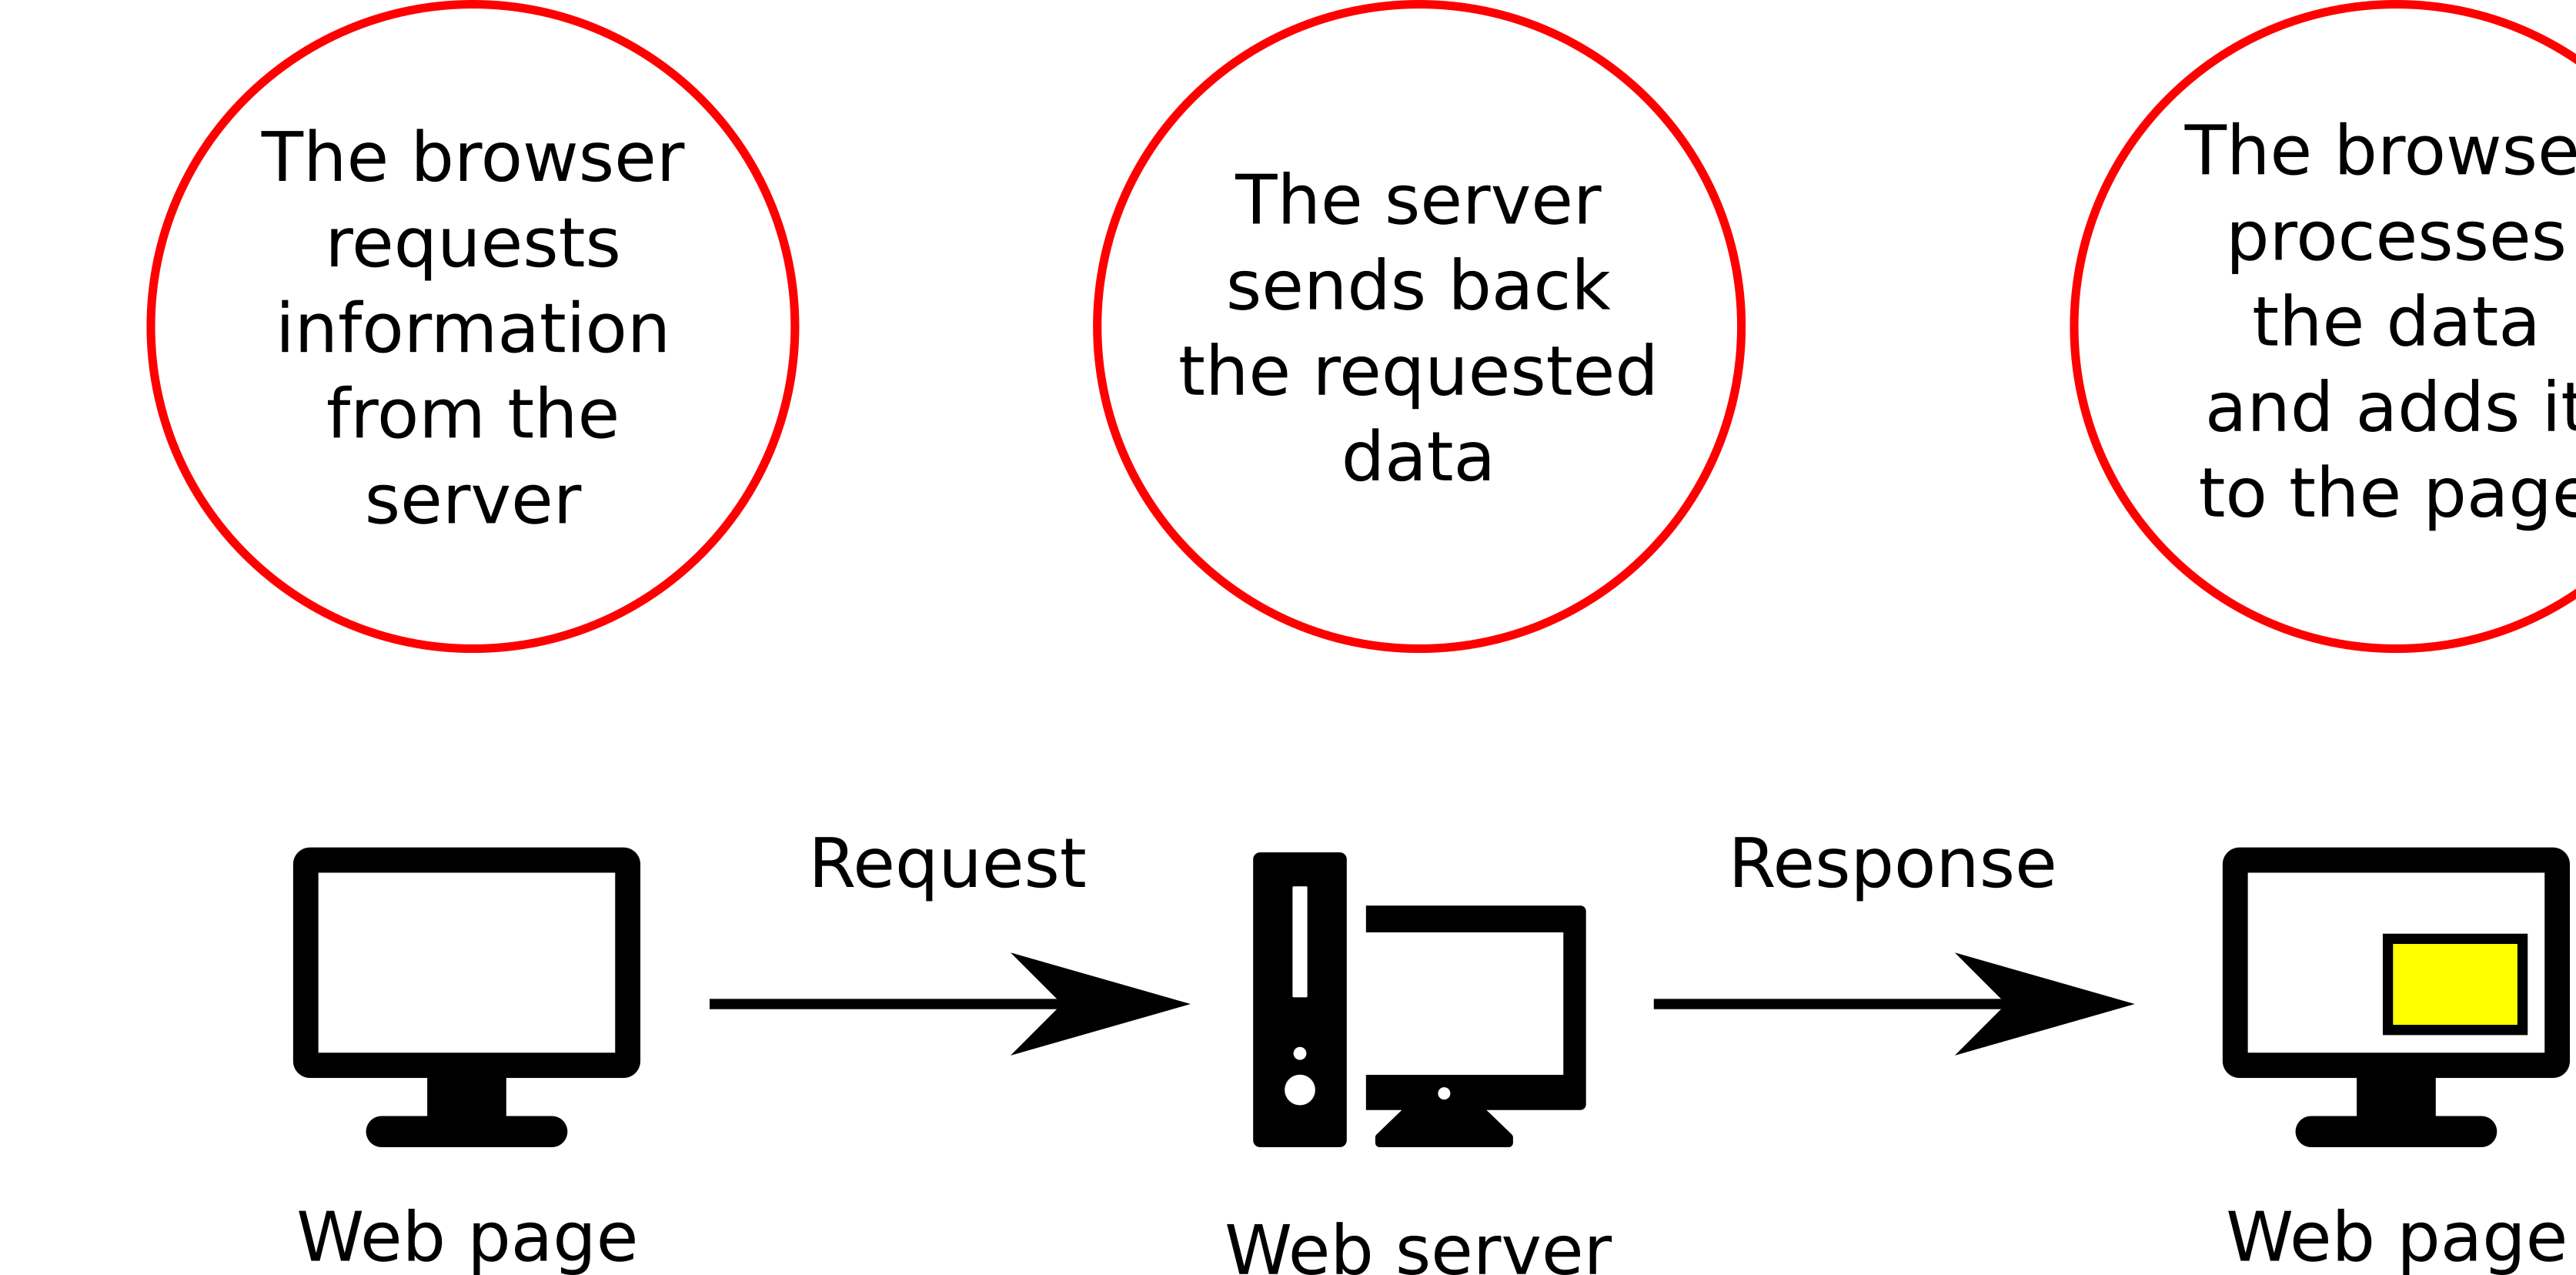
FIGURE 7.7: How Ajax works
XML or JSON are commonly used as the data exchange formats for communication between the server and the client using Ajax. In practice, most modern implementations use JSON, rather than XML, due to its advantages of being native to JavaScript. As we have seen in Section 3.10, JSON can be directly parsed to JavaScript objects, which makes processing of the data very convenient.
7.6.2 Examples
You probably have seen Ajax used on many popular websites, even if you were not aware that it was being used.
For example, the autocomplete feature in search forms commonly uses Ajax. You have probably seen it used on the Google home page https://www.google.com/. When you type into the search bar on the Google, sometimes you will see results coming up before you have finished typing (Figure 7.8). What happens is that the currently entered text is sent to the server, using Ajax. The server then returns the relevant auto-complete suggestions. The suggestions are shown as a dropdown menu below the search bar.
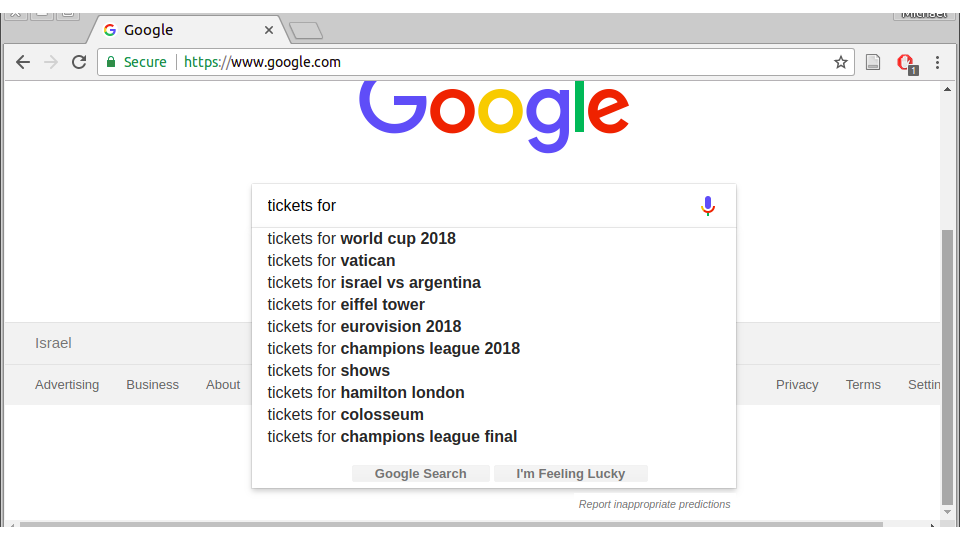
FIGURE 7.8: Auto-complete in Google search
Another example is when you scroll down the page on social network websites, such as Facebook, Instagram or Twitter. Once you reach the bottom of the page, more stories, images or tweets are being loaded and the page becomes longer. When you scroll down once more, again reaching the end of the page, more new content is loaded, and so on. In a way, the home page of those websites is nearly infinite. However, the entire page does not need to be loaded at once, nor does the page need to be completely reloaded each time new content is added at the bottom. When we reach the bottom of the page, new content is being added while all of the previous content and the navigation bars remain unmodified, which improves user experience.
Loading of tile layers on a Leaflet map (Section 6.5.6) is also an example of Ajax. The whole idea of tiles is based on the fact that only the relevant content, specific for the viewed extent and zoom level, is being loaded. Whenever we zoom in or out, or pan around the map, new tile PNG images are being requested with Ajax and added on the map (Figure 6.6), without ever reloading the entire web page. For example, if you’re on a Leaflet map and scroll towards the north, the page’s JavaScript sends an Ajax request the necessary new PNG images from the tile server. The server sends back its response - the new PNG images - which the JavaScript then uses to update the map in the browser.
For a more detailed introduction to Ajax, also see the Fetching data from the server article by Mozilla.
7.6.3 Ajax requests with jQuery
Making Ajax requests is one more kind of task where jQuery greatly simplifies the usual JavaScript syntax, just like we previously saw regarding DOM queries and iteration over objects (Chapter 4).
jQuery provides several functions and methods that handle Ajax requests, summarized in Table 7.6.
| method | description |
|---|---|
.load() |
Loads HTML code into an element. It is the simplest method for retrieving data |
$.get() |
Loads data using the HTTP GET method. Used to request data from the server |
$.post() |
Loads data using the HTTP POST method. Used to send data to be processed on the server |
$.getJSON() |
Loads and parses JSON data using the GET request. Used for JSON strings |
$.getScript() |
Loads and executes JavaScript data using GET. Used for JavaScript code |
$.ajax() |
Performs customized requests. All of the other methods use this method under the hood |
Among these methods, .load is special in that it is a method, used on an element to add HTML content into it. The other five methods are general functions (i.e., methods of the $ object). Also note that the first five functions and methods are in fact shortcuts for special cases of the sixth method $.ajax, which is the general function for making any kind of Ajax request.
For our purposes in this book, the most useful function is the $.getJSON function. The $.getJSON function can be used to load a JSON file using a GET request and immediately parse it to a JavaScript object. This is very convenient for loading and parsing GeoJSON strings, so that the GeoJSON layer can be immediately displayed on a web map. We are going to use the $.getJSON function in most of the examples throughout the rest of the book.
In Section 13.5 we will see one example using the $.post function to compose a POST request for sending data to the database in a crowdsourcing app.
7.7 The $.getJSON function
7.7.1 Overview
To use the $.getJSON function we first need to load the jQuery library. As we already know from Section 4.4, this can be done by adding the following <script> into the <head> of our document -
<script src="js/jquery.js"></script>A basic usage of the $.getJSON function looks like this -
$.getJSON(url, callback);Where -
url- The URL of the JSON filecallback- The function to run if the request succeeds
The callback function can have a data parameter, which refers to the parsed object returned from the server -
$.getJSON(url, function(data) {...});For example, the following $.getJSON call uses a function that prints the parsed object data, obtained from the url, into the console -
$.getJSON(url, function(data) {
    console.log(data);
});
Of course, usually we want to do more than just printing with console.log. For example, the received object can be processed and used to build and append new HTML content on the page, displayed as a layer on a map, and so on. We will see examples of $.getJSON combined with various processing scenarios in subsequent Chapters.
7.7.2 Loading local files
To add the contents of a local GeoJSON file as a layer on our map, we can set the url to a file path of a GeoJSON file on our server. Then, we need a callback function (function(data) {...}) that executes once the GeoJSON is loaded and parsed. The callback function will contain the code that adds the GeoJSON to our map. To add GeoJSON to a Leaflet map, we use L.geoJSON as shown in Section 7.4 above.
Let’s try loading a sample GeoJSON file containing municipal boundaries of towns in Israel, named towns.geojson, and adding the layer on our map. The basic code for loading GeoJSON on a map thus looks as following -
$.getJSON("data/towns.geojson", function(data) {
    L.geoJSON(data).addTo(map);
});
Note that the file towns.geojson is in the data directory, relatively to the HTML document location, therefore we are using the path "data/towns.geojson".
Also note that loading a local file with JavaScript through Ajax only works when viewing the page using a web server, as demonstrated in Section 5.6.1.4. This has to do with security restrictions placed by the browser: loading a local file via JavaScript is usually not permitted directly, but only through a server.
Figure 7.9 shows example-07-03.html, where the towns.geojson layer is loaded on a Leaflet map. Again, you may wonder how can we override the default style of the layer and set our own. As mentioned above, this will be covered in Chapter 8.
FIGURE 7.9: example-07-03.html (Click to view this example on its own)
Check out the Leaflet GeoJSON Tutorial for more details on loading GeoJSON.
7.7.3 Loading remote files
In the last example example-07-03.html we loaded a local GeoJSON file which was stored on the same server along with the HTML document. Using the same method, we can also load GeoJSON files stored in remote locations on the web.
For example, the USGS has a website dedicated to publishing earthquake location data in real time. The website provides continuously updated records of recent earthquake locations. The data are given in several formats, including GeoJSON. For example, the following URL leads to a GeoJSON file with the locations of earthquakes of magnitude above 4.5 in the past 7 days -
https://earthquake.usgs.gov/earthquakes/feed/v1.0/summary/4.5_week.geojson
We can replace "data/towns.geojson" from example-07-03.html with the above earthquakes URL, thus loading remote earthquake locations layer instead of the local towns layer -
var url =
    "https://earthquake.usgs.gov/earthquakes/feed/v1.0/" +
    "summary/4.5_week.geojson";
$.getJSON(url, function(data) {
    L.geoJSON(data).addTo(map);
});
The resulting example-07-04.html is shown on Figure 7.10.
FIGURE 7.10: example-07-04.html (Click to view this example on its own)
Note that due to security reasons, making Ajax requests from a different domain is not allowed by default. The mechanism defining this restriction is called Cross-Origin Resource Sharing (CORS). Basically, the server needs to allow remote connections from your specific domain (or from any domain) for the request to be successful.
The USGS server where the earthquakes GeoJSON is placed allows CORS, which is why example-07-04.html works. In case we are trying to load a file from a server that does not allow CORS, the operation will fail displaying an error such as the following one in the console -
Failed to load http://opendata.br7.org.il/datasets/geojson/BicycleParking.geojson:
No 'Access-Control-Allow-Origin' header is present on the requested resource.
Origin 'http://localhost:8000' is therefore not allowed access.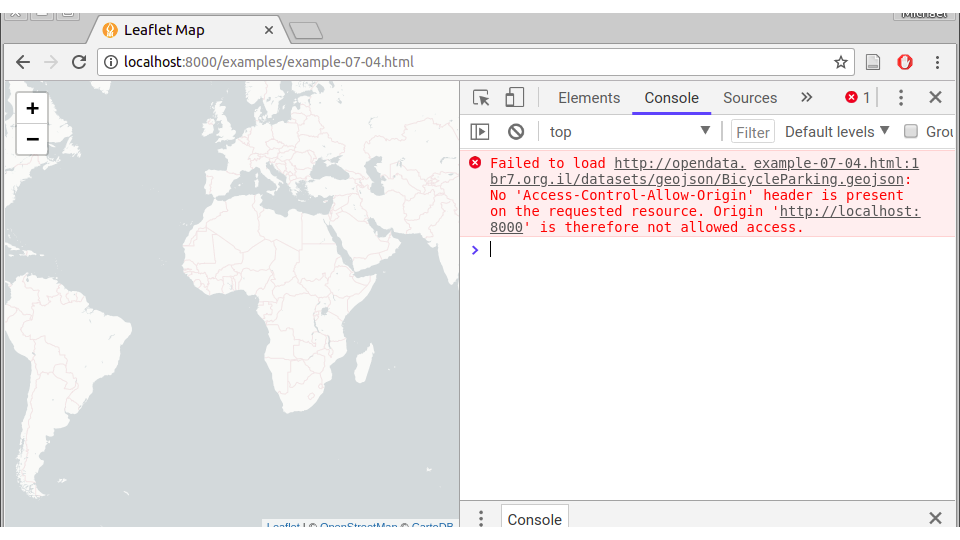
FIGURE 7.11: Error when attempting to load a resource, via Ajax, from a server where CORS is not allowed
If you encounter a CORS error while trying to load a resource, one option is to get the other server to allow CORS. If this is impossible, or you do not have access to the server, you can make the file available for your website through Ajax from a different server - or your own. CORS policy does not affect the access of server-side scripts to the resource, just the access of client-side JavaScript. Therefore the other intermediate server can be used to basically bypass the CORS restriction.
7.8 Exercise
- EONET is a repository with real-time information about natural events. Conveniently, EONET publishes a real-time listing of natural events on earth, available as a JSON file in the following URL - https://eonet.sci.gsfc.nasa.gov/api/v2.1/events
- Build a web map where locations of recent severe storms are shown. The popup of each feature will display the storm name and observation time.
- Consider the following issues
- The JSON object has a property named
events, which is an array of event observations- Each event has an
id, specifying event type, andgeometries, which is an array of GeoJSON objects specifying event location and time- To filter event types, use the categories specification given in https://eonet.sci.gsfc.nasa.gov/api/v2.1/categories. For example, the categoty ID for severe storm events is
10- Hint: Start with manually adding one geometry from the JSON file on the map, such as
x.events[0].geometries[0], wherexis the parsed object, then try to generalize your code to iterate over all geometries
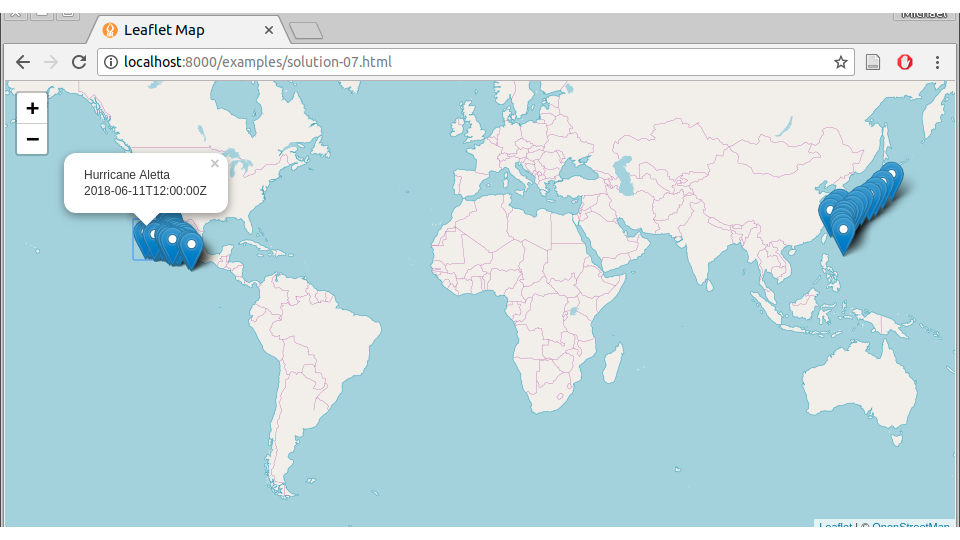
FIGURE 7.12: solution-07.html