Chapter 10 Non-spatial queries
Last updated: 2018-11-11 20:44:59
10.1 Introduction
In Chapter 9, we introduced the CARTO SQL API, and used it to display the result of a database query on a Leaflet map (Figure 9.7). The query we used was constant: the same observations, namely the first 25 records in the plants table, were deterministically loaded. In this Chapter we are going to extend this example with a user interface where one can choose which subset of the data gets downloaded and displayed. Specifically, we will use an input element where the user selects a species name, which we will use to dynamically generate an SQL query for filtering the plants table and getting the observations for that particular species only. That way, the user is able to load all observations for one plant species at a time.
We will accomplish the above in several steps -
- Experiment with queries for loading a subset of records from a database onto a Leaflet map (Section 10.2.2), using SQL filtering based on attribute values (Section 10.2.1)
- Add a
<select>input for choosing a species (Section 10.3) - Collect all unique species names, also using SQL (Section 10.4.3)
- Automatically add all unique species names as
<option>elements inside<select>(Section 10.4.4) - Bind the list with the map, so that changing our species choice will load new observations on the map (Section 10.5.3)
The final result we aim at in this Chapter is shown on Figure 10.7.
10.2 Subsetting with SQL
10.2.1 Filtering based on attributes
In Chapter 9, we used the following SQL query to load the first 25 records from the plants table on a Leaflet map (Figure 9.7).
SELECT *
  FROM plants
  LIMIT 25;
As mentioned in Section 9.6.2, using SQL we can also filter the returned data, using the WHERE keyword combined with one or more criteria. For example, the name_lat column specifies the Latin name of the observed species in the plants table. In case we want to select the observation of just one species, we can add the WHERE name_lat = '...' expression to our SQL query, with ... being the species name of interest. For example, the following expression gives all observations where the name_lat is equal to 'Iris mariae' (Figure 10.1).
SELECT *
  FROM plants
  WHERE name_lat = 'Iris mariae';
For simplicity, let’s add LIMIT 1 to examine just the first observation for 'Iris mariae' -
SELECT *
  FROM plants
  WHERE name_lat = 'Iris mariae'
  LIMIT 1;
When working with CARTO we can execute this query with the corresponding SQL API call -
https://michaeldorman.carto.com/api/v2/sql?format=GeoJSON&q=
SELECT * FROM plants WHERE name_lat = 'Iris mariae' LIMIT 1;
Here is the returned GeoJSON string -
{
  "type": "FeatureCollection",
  "features": [
    {
      "type": "Feature",
      "geometry": {
        "type": "Point",
        "coordinates": [
          34.412502,
          31.019879
        ]
      },
      "properties": {
        "cartodb_id": 26,
        "id": 358449,
        "sp_id": 30,
        "observer": "ערן היימס",
        "presence": 1,
        "obsr_date": "2010-03-13T00:00:00Z",
        "population_type": 1,
        "model": "obs.obsr",
        "name_heb": "אירוס הנגב",
        "name_lat": "Iris mariae"
      }
    }
  ]
}
Indeed, this is a "FeatureCollection" with just one feature and all available attributes, representing a single record for 'Iris mariae' as requested from the server.
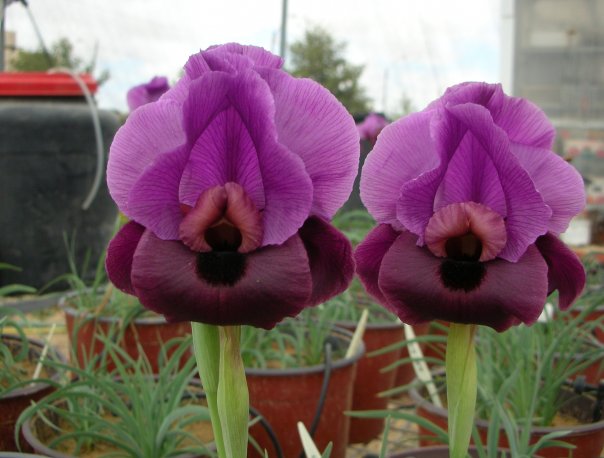
FIGURE 10.1: Iris mariae. Image taken at an ecological greenhouse experiment at the Ben-Gurion University in 2008
10.2.2 Displaying on a map
For adding the observations of a single species on a Leaflet map, we can take example-09-01.html from Section 9.8 and modify just the SQL query part. Instead of the query we used in example-09-01.html we can use the new one which we have just constructed, where an individual species is being selected -
SELECT *
  FROM plants
  WHERE name_lat = 'Iris mariae';
Or better yet, rather than requesting all table columns with SELECT * we can limits the returned columns to just the ones we need, for minimizing the size of transferred data. In this case we need the name_lat column (for popup content, see below), and the_geom column for being able to export a GeoJSON object. Thus SELECT * becomes SELECT name_lat, the_geom -
SELECT name_lat, the_geom
  FROM plants
  WHERE name_lat = 'Iris mariae';
After creating the map object and loading a tile layer, the following code is inserted to load the observations for 'Iris mariae' on the map, along with popups -
var urlGeoJSON = "https://michaeldorman.carto.com/api/v2/sql?" +
    "format=GeoJSON&q=";
var sqlQuery1 = "SELECT name_lat, the_geom FROM plants " +
    "WHERE name_lat = 'Iris mariae'";

$.getJSON(urlGeoJSON + sqlQuery1, function(data) {
    L.geoJSON(data, {
        onEachFeature: function(feature, layer) {
            layer.bindPopup(
                "<i>" + feature.properties.name_lat + "<i>"
            );
        }
    }).addTo(map);
});
This code section is very similar to the ones we used to load GeoJSON of the real-time earthquake locations or towns boundaries in Chapters 7 and 8, respectively. It incorporates the $.getJSON function for loading GeoJSON with Ajax (Section 7.6.3), as well as the onEachFeature option of L.geoJSON to bind specific popups per feature (Section 8.5). In this case the popup displays the name_lat attribute value, in italic font. The novel part, introduced in Chapter 9, is that instead of loading a static GeoJSON from a file or from a URL, we are requesting the GeoJSON content from the CARTO SQL API, using a URL for a specific SQL query as given in sqlQuery1.
The resulting map (example-10-01.html) with marked 'Iris mariae' observations is shown on Figure 10.2.
FIGURE 10.2: example-10-01.html (Click to view this example on its own)
10.4 Populating dropdown options
10.4.1 How many species do we have?
Before looking into the dropdown menu construction, let’s check how many different plant species we actually have in the database. The following SQL query can be used to do that -
SELECT COUNT(DISTINCT name_lat) AS n
  FROM plants;
We are using the COUNT function along with the DISTINCT keyword to get the number of unique values in the name_lat column, putting the result into a new column named n. The result is a small table with one column (n) and one row, as follows -
  n
-----
 417
(1 row)
We can get this result with the CARTO SQL API too, as follows -
https://michaeldorman.carto.com/api/v2/sql?q=
SELECT COUNT(DISTINCT name_lat) AS n FROM plants;
Here is the response -
{
  "rows": [
    {
      "n": 417
    }
  ],
  "time": 0.04,
  "fields": {
    "n": {
      "type": "number"
    }
  },
  "total_rows": 1
}
Since we omitted the format parameter, the result is a JSON object. Remember that, as mentioned in Section 9.7.2, applying a non-spatial query such as the one above with the format=GeoJSON option will result in an error, because in order to produce a GeoJSON object the query must include the geometry column. When output format is set to JSON, the "rows" property of the resulting object is the actual returned content. The other properties in the JSON object are metadata coming from the API, with information regarding processing time ("time"), the column data types ("fields") and the total number of rows ("total_rows").
The "rows" property is structured as an array, with array elements representing table rows. Each element is an object, representing all of the column values for that table row. In this case, there is just one row and one column, which is why the array has just one element, and that element is an object with just one property -
[{"n": 417}]The response tells us that there are 417 species in the plants table. Manually writing the <option> elements for each one of them is obviously not a good idea. Automating the construction of HTML code with 417 <option> element will be more convenient. What is more important, however, is the fact that our dynamically generated dropdown menu will be based on the exact species present in the database, in real-time. In other words, with the dynamic approach we no longer need to worry about updating the HTML code in case the database changes, since the HTML code is built based on content from the database itself and is always up-to-date. Remember that unlike a local file, the CARTO database, just like any other database, may be accessed and modified by different users on different platforms. For example, a database with a list of rare and protected species may be periodically updated by the GIS department of the Nature and Parks authority, adding new observations, removing species that are no longer considered rare, and so on. When our web page connects to the database to dynamically generate its contents each time we browse, we do not need to worry about changing the code to reflect database changes; the changes will be automatically reflected each time the database is queried.
- Removing the
DISTINCTkeyword from the above query gives the overall number of values in thename_latcolumn, that is, the total number of records in the table- Execute the query through the CARTO SQL API to find out how many plant observations are there in the
plantstable
10.4.3 Finding unique values
The following SQL query can be used to get the list of unique values in the name_lat column of the plants table -
SELECT DISTINCT name_lat
  FROM plants
  ORDER BY name_lat;
The SELECT DISTINCT keyword combination before the name_lat column name ensures that we only get the unique values in that column. We are also using the ORDER BY keyword to have the resulting table of species names sorted by alphabetical order of their names. It makes sense that the options in the dropdown menu are alphabetically ordered: that way the user can easily locate the species he/she is interested in, by scrolling towards that species and/or by typing its first letter with the keyboard. Also, all species of the same genus will be listed together since they start with the same word.
You can test the above query with the CARTO API -
https://michaeldorman.carto.com/api/v2/sql?q=
SELECT DISTINCT name_lat FROM plants ORDER BY name_lat
The JSON result should look as follows -
{
  "rows": [
    {"name_lat":"Abutilon indicum"},
    {"name_lat":"Acinos rotundifolius"},
    {"name_lat":"Adonis aestivalis"},
    ...
  ]
  "time": 0.032,
  "fields": {
    "name_lat": {
      "type": "string"
    }
  },
  "total_rows": 417
}
The "rows" property, which contains the returned table, is deprecated here to save space, with the ... symbol representing further objects for the other 414 species not shown.
We will use this response to fill up the dropdown menu where the user selects a species to display on the map.
10.4.4 Adding the options
To populate the dropdown menu, we need to incorporate the above SQL query into our script. First, we set a variable sqlQuery2 for the SQL query listing the distinct species. We now have two different SQL queries: the one for loading observations for one species sqlQuery1, and the one for finding unique species names sqlQuery2. For now, in sqlQuery1 we manually set the first displayed species to 'Abutilon indicum', since it is the first species in terms of alphabetic ordering (see above SQL API response) and therefore comprising the first option in the dropdown menu. Later on (Section 10.6) we will replace this with an automatic way to determine the first species to load, without hard-coding its name into the script.
Also note that we have two different URL prefixes, urlJSON for getting sqlQuery2 in JSON format (the unique species names) and urlGeoJSON, with the format=GeoJSON option, for getting sqlQuery1 in GeoJSON format (the plant observations).
var urlJSON = "https://michaeldorman.carto.com/api/v2/sql?q=";
var urlGeoJSON = "https://michaeldorman.carto.com/api/v2/sql?" +
    "format=GeoJSON&q=";
var sqlQuery1 = "SELECT name_lat, the_geom FROM plants " +
    "WHERE name_lat = 'Abutilon indicum'";
var sqlQuery2 = "SELECT DISTINCT name_lat FROM plants " +
    "ORDER BY name_lat";
Second, we insert the following expression for constructing the dropdown menu based all unique species names in the database -
$.getJSON(urlJSON + sqlQuery2, function(data) {
    $.each(data.rows, function(index, value) {
        $("#species_sel").append(
            '<option value="' + value.name_lat + '">' +
                value.name_lat +
            '</option>'
        );
    });
});
This is an Ajax request using $.getJSON. What does it do? Let’s go over the code step by step.
- The
$.getJSONfunction is used to load JSON content with unique species names from the database, usingurlJSON+sqlQuery2, as an object nameddata. The contents ofdatais the same as shown in the JSON printout from Section 10.4.3 - Then, the
$.eachfunction is used to iterate over each element in therowsproperty ofdata(i.e. the returned table rows), applying a function which -- Uses a DOM selector with a reference to the
#species_selelement, i.e. our dropdown menu - Appends an internal
<option>element before the closing tag of the referred<select>element, with the content being thename_latproperty of the current row value
- Uses a DOM selector with a reference to the
Note that in the above example, we are actually searching for the dropdown menu reference "#species_sel" in the DOM for 417 times, since the expression $("#species_sel") is executed inside the iteration. This is not necessary. We can locate the "#species_sel" element just once, keeping its reference in a variable (named menu in the example below). That way, the browser searches for the #species_sel reference only once, and uses the same reference inside the iteration. The performance difference is negligible in this case, but this is an example of an optimization: getting rid of actions that are unnecessarily repeated in our code.
$.getJSON(urlJSON + sqlQuery2, function(data) {
    var menu = $("#species_sel");
    $.each(data.rows, function(index, value) {
        menu.append(
            '<option value="' + value.name_lat + '">' +
                value.name_lat +
            '</option>'
        );
    });
});
As a result of adding either of the last two code sections, we now have a map (example-10-03.html) with a dropdown menu listing all available species. The observations of the first species on the list are shown on the map on page load (Figure 10.4).
FIGURE 10.4: example-10-03.html (Click to view this example on its own)
- Insert a
console.logexpression inside the<script>ofexample-10-03.htmlso that the name of each species is printed in the console as it is being added to the list of options- You should see a printout such as shown on (Figure 10.5)
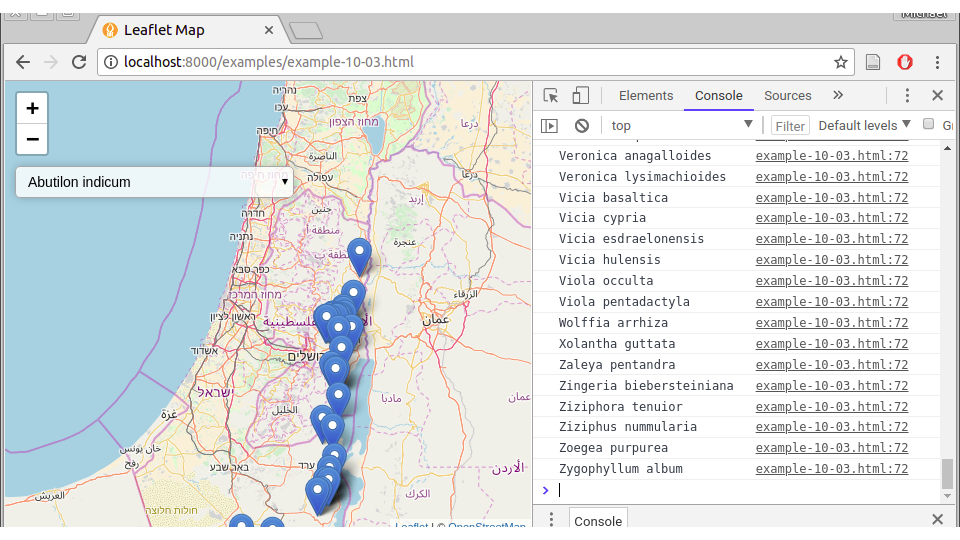
FIGURE 10.5: Species names printed with console.log
10.5 Updating the map
10.5.1 Overview
We now have a web page showing observations of the first species from the plants table, as well as a dropdown menu with all species that are present in the plants table.
Try clicking on the dropdown menu and selecting a species. Nothing happens! What’s still missing is an event listener, triggering an update of the plants layer on selection change. In the present case, the event listener function should do the following things whenever the species selection changes -
- Clear the map of all previously loaded observations
- Define a new SQL query for getting the observations corresponding to the species currently selected in the dropdown menu
- Send the SQL query to the database and get the observations, as GeoJSON
- Display the new observations on the map
10.5.2 Manual example
Before setting up the event listener it is sometimes convenient to start with a manually defined, specific case. Suppose the user chose a different species instead of 'Abutilon indicum', say 'Iris mariae', in the dropdown menu. The code for adding display a new species on the map is exactly the same as the one we used for 'Abutilon indicum'. The only thing that’s changed is the species name in the SQL query. Try entering the following code section into the console in the above example. This load new observations, for 'Iris mariae', on top of the existing ones for 'Abutilon indicum' -
var valueSelected = "Iris mariae";
var sqlQuery3 =
    "SELECT name_lat, the_geom FROM plants " +
    "WHERE name_lat = '" + valueSelected + "'";
$.getJSON(urlGeoJSON + sqlQuery3, function(data) {
    L.geoJSON(data, {
        onEachFeature: function(feature, layer) {
            layer.bindPopup(
                "<i>" + feature.properties.name_lat + "<i>"
            );
        }
    }).addTo(map);
});
- Change the value of
valueSelectedin the above code section to a different species name from the list and execute the code section in the console- You should see observations of the species you chose added on the map
10.5.3 Automatic updating
In the last code section we manually added new observations of another species from the database. What we now need is to associate this code section with dropdown menu changes. In other words, we want the selection of a new species in the menu to trigger the automatic removal of the old observations and loading the new ones. This is where the event listener comes into play.
The first thing we do is define a layerGroup named plantsLayer and add it on the map. The named layer group can be referenced later on, to clear it or add layers into it. This will make it easier for us to clear any previously loaded species and add markers for the currently selected one. Recall the GeoJSON viewer in example-07-02.html from Section 7.5, where we used a layer group for clearing old GeoJSON layers whenever a new one is submitted from the text area input.
var plantsLayer = L.layerGroup().addTo(map);Accordingly, we change the .addTo(map) part with .addTo(plantsLayer) when loading the initial species on the map. So, the following piece of code from example-10-03.html -
$.getJSON(urlGeoJSON + sqlQuery1, function(data) {
    L.geoJSON(...).addTo(map);
});
Is changed to this one in example-10-04.html -
$.getJSON(urlGeoJSON + sqlQuery1, function(data) {
    L.geoJSON(...).addTo(plantsLayer);
});
The second thing we do is “wrap” the manual example from the previous section (which loaded "Iris mariae"), so that -
- It is contained inside an event listener function, responding to changes in the dropdown menu (
"#species_sel"). The appropriate event type (see Section 4.2.3) in this case is"change", which means that any change in the input element triggers the even listener - The old observations are cleared before adding new ones, using
.clearLayers() - The species name to load from the database is determined from the currently selected value in the dropdown menu, using
$("#species_sel").val()(rather than hard coded as"Iris mariae")
The following code section does all of that -
$("#species_sel").on("change", function() {
    plantsLayer.clearLayers();
    var valueSelected = $("#species_sel").val();
    var sqlQuery3 =
        "SELECT name_lat, the_geom FROM plants " +
        "WHERE name_lat = '" + valueSelected + "'";
    $.getJSON(urlGeoJSON + sqlQuery3, function(data) {
        L.geoJSON(data, {
            onEachFeature: function(feature, layer) {
                layer.bindPopup(
                    "<i>" + feature.properties.name_lat + "<i>"
                );
            }
        }).addTo(plantsLayer);
    });
});
Let’s review the code, step by step. In the external part of the expression, we see that an event listener is being binded to a DOM selection -
$("#species_sel").on("change", function() {
    ...
});
More specifically, an anonymous function is being set to execute every time the input element "#species_sel" changes. Let’s now review the body of that function.
First thing, the function clears the contents of the plantsLayer. This means that any new selection on the dropdown menu clears the map of any “old” markers -
plantsLayer.clearLayers();Next, the function defines a new variable named valueSelected -
var valueSelected = $("#species_sel").val();The value of valueSelected is the name of the currently selected species on the dropdown list. The current value is obtained with the .val method, which we learned about in Section 4.6.6. Recall the calculator example example-04-09.html where we used .val to get the currently entered numbers for displaying their multiplication product (Section 4.13).
Second, valueSelected is being used to construct a new SQL query string sqlQuery3. This query will be used to request the observations of the newly selected species from the database -
var sqlQuery3 =
    "SELECT name_lat, the_geom FROM plants " +
    "WHERE name_lat = '" + valueSelected + "'";
Finally, the new GeoJSON content is being requested with urlGeoJSON+sqlQuery3 and the $.getJSON function. The returned GeoJSON object is then added on the map using L.geoJSON and .addTo(plantsLayer) -
$.getJSON(urlGeoJSON + sqlQuery3, function(data) {
    L.geoJSON(data, {
        onEachFeature: function(feature, layer) {
            layer.bindPopup(
                "<i>" + feature.properties.name_lat + "<i>"
            );
        }
    }).addTo(plantsLayer);
});
The resulting map (example-10-04.html) is shown on Figure 10.6. Thanks to the event listener, the dropdown menu is now functional and the map is responsive to the current species selection.
FIGURE 10.6: example-10-04.html (Click to view this example on its own)
10.6 Rearranging the code
Going over the complete code of example-10-04.html (above), you may notice one important drawback: there are two code section doing practically the same thing. Namely, we have the following code section for loading the initial query sqlQuery1, displaying the initial species from the database on page load -
$.getJSON(urlGeoJSON + sqlQuery1, function(data) {
    L.geoJSON(...).addTo(plantsLayer);
});
And we also have the event listener, which does the same thing for each subsequently selected species, using a dynamically generated query sqlQuery3 -
$("#species_sel").on("change", function() {
    plantsLayer.clearLayers();
    var valueSelected = $("#species_sel").val();
    var sqlQuery3 =
        "SELECT name_lat, the_geom FROM plants " +
        "WHERE name_lat = '" + valueSelected + "'";
    $.getJSON(urlGeoJSON + sqlQuery3, function(data) {
        L.geoJSON(data, {...}).addTo(plantsLayer);
    });
});
This duplication contradicts the DRY (Don’t Repeat Yourself) principle, an essential guideline in computer programming. Basically, unnecessarily duplication makes our code more difficult to manage, since we need keep track of all duplicated parts and make sure they are synchronized every time we make changes in our code. For example, suppose we decide to change the popup content for the plant observation markers, say, adding the observation date below the species name. In the current code structure, we need to change the respective code inside L.geoJSON in two places: the L.geoJSON function call that loads the initial species and the L.geoJSON function call that loads any subsequently selected species. If we forget to change one of those places, then popup content will look different depending whether we used the dropdown menu or not, which is clearly undesired.
One more inconvenience in the present code configuration is that the initial species, the one displayed on map load, is hard-coded in sqlQuery1 (it is 'Abutilon indicum'). Like we said earlier, the database may be changed in the future, so that 'Abutilon indicum' may be removed or a new species with alphabetical precedence will be added. In such case the initial view will be incorrect: the species initially loaded on the map will no longer match the first species inside the dropdown menu. Again, it is beneficial to determine the first species to load according to the database, rather than based on a constant string.
The solution to the duplication issue is to use a function, which also makes our code slightly shorter and more elegant. Instead of repeating the above code section in two places, we wrap the second code section - the one for loading the currently selected species - in a new function called displaySpecies -
function displaySpecies() {
    plantsLayer.clearLayers();
    var valueSelected = $("#species_sel").val();
    var sqlQuery3 =
        "SELECT name_lat, the_geom FROM plants " +
        "WHERE name_lat = '" + valueSelected + "'";
    $.getJSON(urlGeoJSON + sqlQuery3, function(data) {
        L.geoJSON(data, {
            onEachFeature: function(feature, layer) {
                layer.bindPopup(
                    "<i>" + feature.properties.name_lat + "<i>"
                );
            }
        }).addTo(plantsLayer);
    });
}
The displaySpecies function can be used in an .on("change", ...) event listener, just like the anonymous function was in the previous version, so the event listener definition from example-10-04.html -
$("#species_sel").on("change", function() {...});Becomes this in example-10-05.html -
$("#species_sel").on("change", displaySpecies);This change takes care of clearing the map and loading a new species whenever the dropdown menu selection changes. However, how will the initial species be added on map load? To do that, we simply need to call the function one more time in our script, outside of the event listener. The appropriate place to call the function is inside the Ajax request constructing the dropdown menu. That way, the first species is displayed right after the dropdown menu is filled with all of the unique species names.
$.getJSON(urlJSON + sqlQuery2, function(data) {
    var menu = $("#species_sel");
    $.each(data.rows, function(index, value) {
        menu.append(
            '<option value="' + value.name_lat + '">' +
                value.name_lat +
            '</option>'
        );
    });
    displaySpecies();
});
Since displaySpecies is being called after the dropdown menu is already built, we can be sure that the initially loaded species corresponds to the first selected <option>.
The resulting map (example-10-05.html) is shown on Figure 10.7. Visually it is the same as example-10-05. However, the underlying code is now improved.
FIGURE 10.7: example-10-05.html (Click to view this example on its own)
10.7 Exercise
- Build a web map with two dropdown menus - for genus and species of rare plants (Figure 10.8)
- When the user selects a genus, the second dropdown should automatically update to list the species in that genus
- The user then selects a species to show it on the map
- If the user makes no selection, the first species in each genus should be automatically shown on the map
- This is a challenging exercise, so here is a hint on how to start. Run the following code section in the console of
example-10-05.html. This piece of code constructs an object namedspecies, whose properties are genus names and values are arrays with all species in that genus. Expand the code and use thespeciesobject to populate the dropdown menus.
var species = {};
$.getJSON(urlJSON + sqlQuery2, function(data) {
    $.each(data.rows, function(index, value) {
        var tmp = value.name_lat;
        var tmp_split = tmp.split(" ");
        if(species[tmp_split[0]] === undefined) {
            species[tmp_split[0]] = [tmp];
            } else {
                species[tmp_split[0]].push(tmp);
            }
    });
});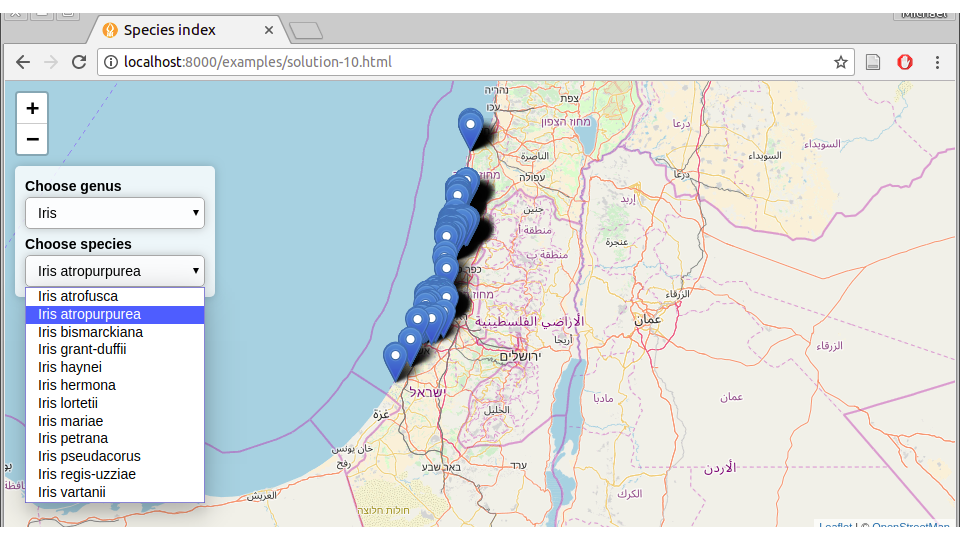
FIGURE 10.8: solution-10.html