D Exercise 02
Last updated: 2020-08-12 00:41:46
D.1 Question 1
- Run the following four expressions to load two vectors named
yearandco2into memory
- The
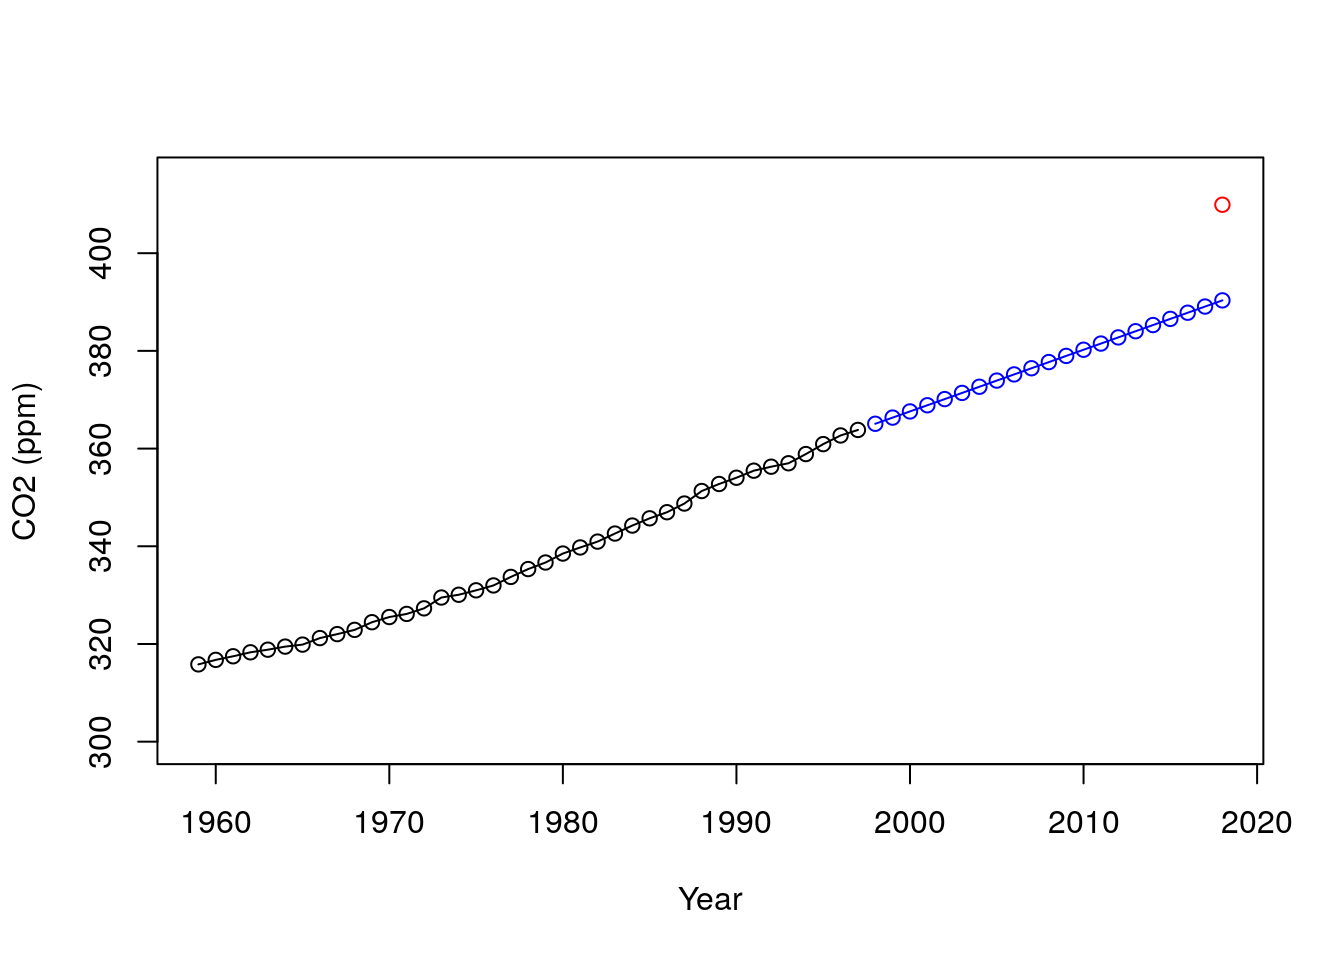
co2vector contains \(CO_2\) measurements in the atmosphere, in ppm units, during the period 1959-1997. Theyearvector contains the corresponding years. - Assuming that the rate of \(CO_2\) increase was constant and equal to the average rate during 1959-1997, calculate the predicted \(CO_2\) concentration during each of the years 1998-2018.
- Create a plot (Figure D.1) showing \(CO_2\) concentration as function of time, with:
- Observed values during 1959-1997, based on the
yearandco2vectors, in black - Predicted values during 1998-2018 in blue
- Observed values during 1959-1997, based on the
- Add a point in red showing the true concentration in 2018, which was
409.92.

Figure D.1: \(CO_2\) over time
(50 points)
D.2 Question 2
- Read the
rainfall.csvfile into adata.frameobject - Find and print the station names where all nine months are with <10 mm of rainfall
## [1] "Yotveta" "Eilat"- Note: you can define the vector
mwith month names in your code to subset the columns with monthly rainfall amounts, as shown in Section 4.4.3.
(50 points)