E Exercise 03
Last updated: 2020-08-12 00:41:46
E.1 Question 1
- Read the raster
MOD13A3_2000_2019.tifto a multi-band raster object namedr. - Calculate a vector of length 24 with the correlation coefficients between the values of the layer 1, and the values of layers 1, 2, …, 24.
- To calculate correlation coefficients use the
corfunction with theuse="pairwise.complete.obs"argument, as in:cor(x, y, use="pairwise.complete.obs"). - For example, the 2nd value in the vector should be equal to:
## [1] 0.9752619- Plot the values of the vector, as shown in Figure E.1.
- Remember: you cannot use the
rasterpackage in your solution! (see Section B.5.5.) - Note: the two arguments passed to the
corfunction, i.e., the pixel values of layer 1 and layer n, need to be either vectors or arrays (not matrices). If necessary, amatrixcan be converted to a vector withas.vector.
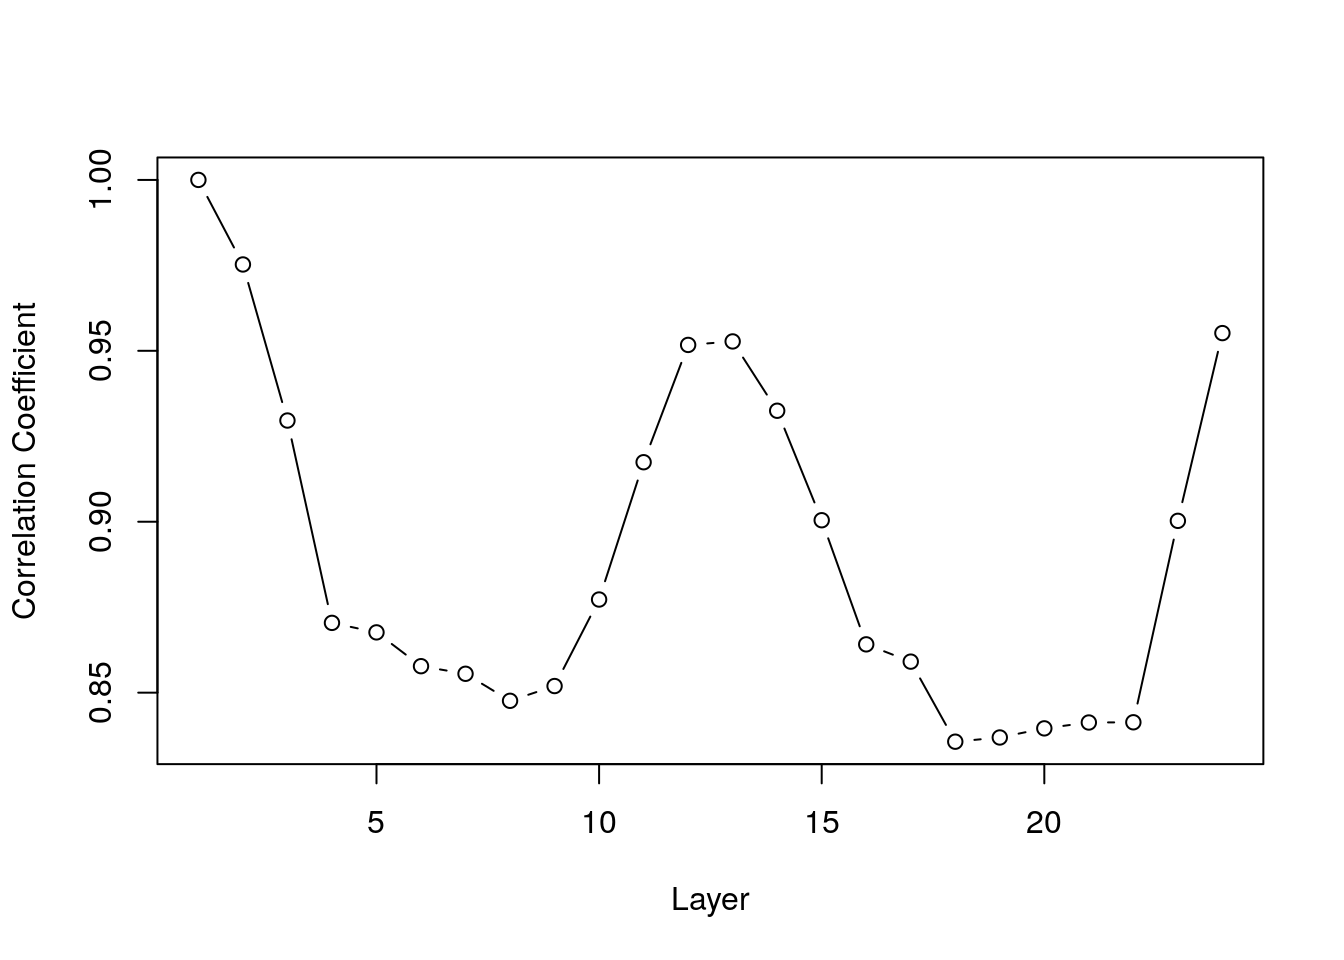
Figure E.1: Correlation between NDVI values in layer 1 and layers 1-24
(50 points)
E.2 Question 2
- Read the raster
MOD13A3_2000_2019.tifto a multi-band raster object namedr. - Create a vector of length 233, so that the
i’s value of the vector is equal to the proportion ofNAvalues in thei’s layer ofr. - Plot the vector with lines and points, as shown in Figure E.2.
- The x-axis should display the years, based on the
MOD13A3_2000_2019_dates.csvfile. - Remember: you cannot use the
rasterpackage in your solution! (see Section B.5.5.)
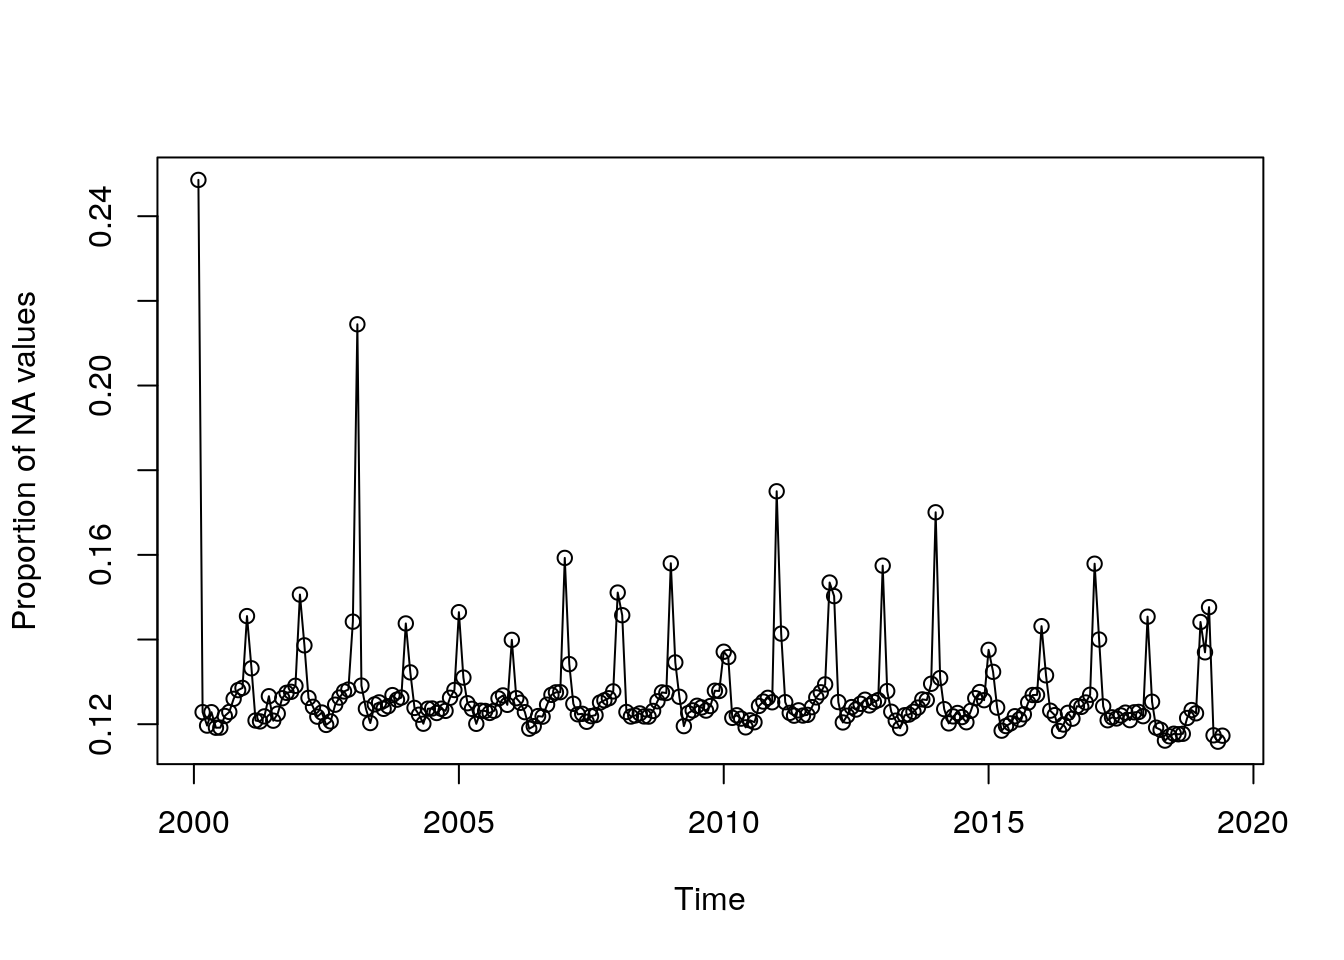
Figure E.2: Proportion of NA values over time
(50 points)