Introduction to Spatial Data Programming with R
Preface
Last updated: 2020-08-12 00:35:24
0.1 What is R?
R is a programming language and environment, originally developed for statistical computing and graphics. As of October 2019, there are ~15,000 R packages in the official repository CRAN1.
Notable advantages of R are that it is a full-featured programming language, yet customized for working with data, relatively simple and has a huge collection of over 100,000 functions from various areas of interest.
R’s popularity has been steadily increasing in recent years (Figures 0.1–0.3).
![Stack Overflow Trend for the 'r' question tag^[https://insights.stackoverflow.com/trends?tags=r]](images/lesson_01_r_trend.png)
Figure 0.1: Stack Overflow Trend for the ‘r’ question tag2
Figure 0.2: IEEE Language Rankings 20193
![Proportion of research papers citing R^[https://www.nature.com/news/programming-tools-adventures-with-r-1.16609]](images/lesson_01_rising_tide_of_R.jpg)
Figure 0.3: Proportion of research papers citing R4
A brief overview of the capabilities and packages for several domains of R use, are available in the “CRAN Task Views” (Figure 0.4).
![CRAN Task Views^[http://www.maths.lancs.ac.uk/~rowlings/R/TaskViews/]](images/lesson_01_cran_task_views.png)
Figure 0.4: CRAN Task Views5
0.2 R and analysis of spatial data
0.2.1 Introduction
Over time, there was an increasing number of contributed packages for handling and analyzing spatial data in R. Today, spatial analysis is a major functionality in R. As of October 2019, there are 194 packages6 specifically addressing spatial analysis in R.
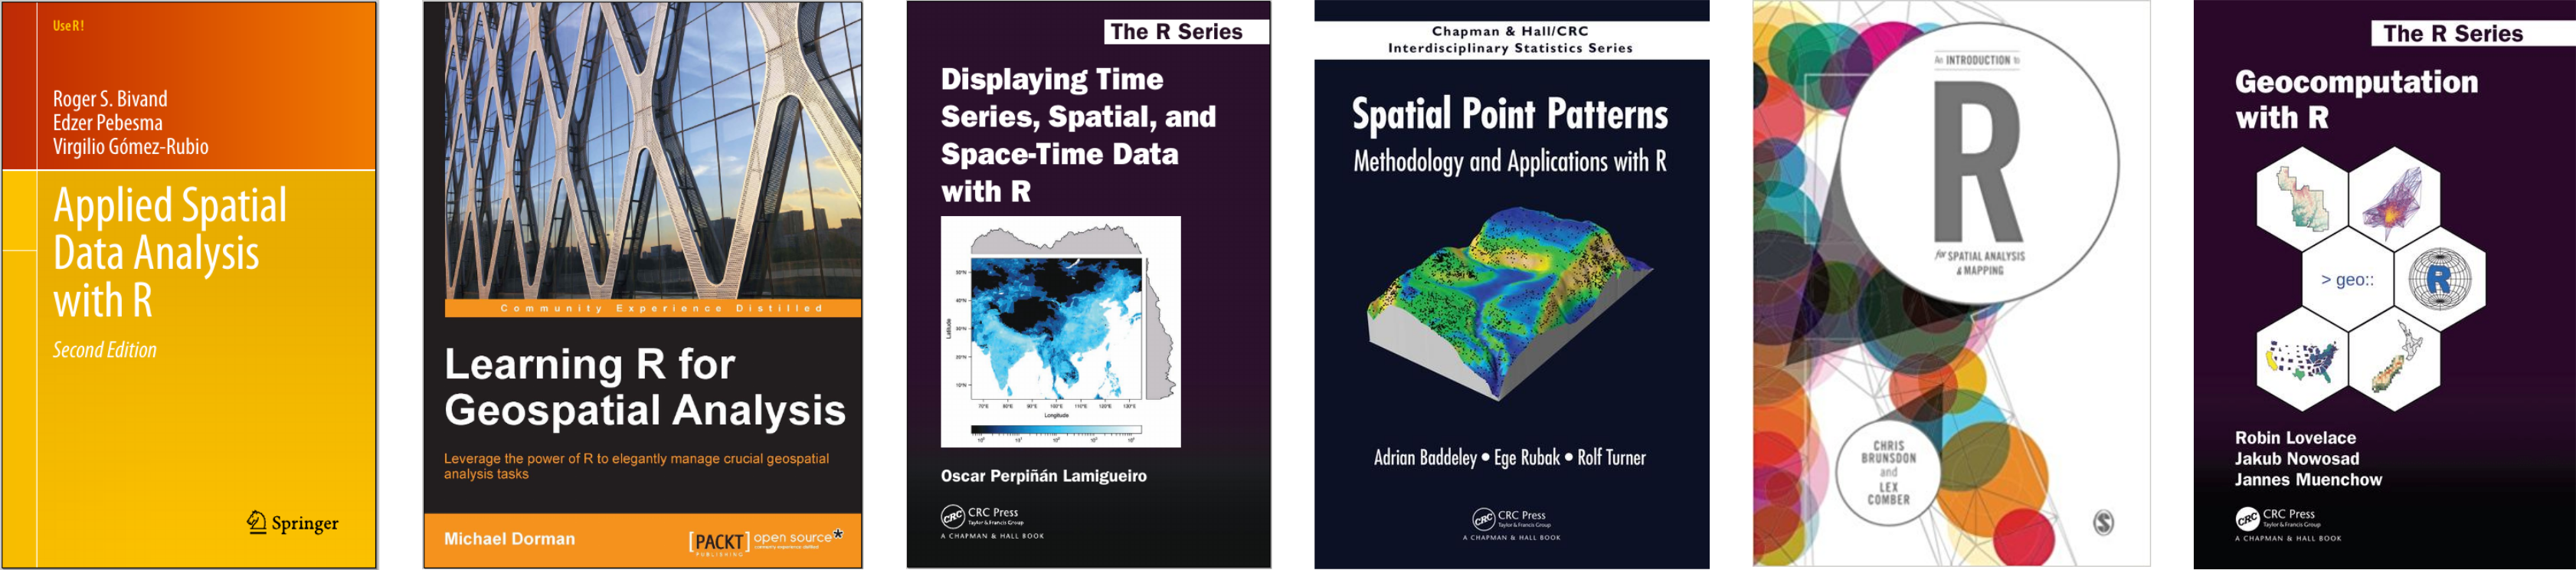
Figure 0.5: Books on Spatial Data Analysis with R
Some important events in the history of spatial analysis support in R are summarized in Table 0.1.
| Year | Event |
|---|---|
| pre-2003 | Variable and incomplete approaches (MASS, spatstat, maptools, geoR, splancs, gstat, …) |
| 2003 | Consensus that a package defining standard data structures should be useful; rgdal released on CRAN |
| 2005 | sp released on CRAN; sp support in rgdal |
| 2008 | Applied Spatial Data Analysis with R, 1st ed. |
| 2010 | raster released on CRAN |
| 2011 | rgeos released on CRAN |
| 2013 | Applied Spatial Data Analysis with R, 2nd ed. |
| 2016 | sf released on CRAN |
| 2018 | stars released on CRAN |
| 2019 | Geocomputation with R (https://geocompr.robinlovelace.net/) |
| 2020(?) | Spatial Data Science (https://keen-swartz-3146c4.netlify.com/) |
The question that arises here is: can R be used as a Geographic Information System (GIS), or as a comprehensive toolbox for doing spatial analysis? The answer is definitely yes. Moreover, R has some important advantages over traditional approaches, mainly software with graphical user interfaces, like ArcGIS or QGIS.
General advantages of Command Line Interface (CLI) software include:
- Automation—Doing otherwise unfeasible repetitive tasks
- Reproducibility—Precise control of instructions to the computer
Moreover, specific strengths of R as a GIS are:
- R capabilities in data processing and visualization, combined with dedicated packages for spatial data
- A single environment encompassing all analysis aspects—acquiring data, computation, statistics, visualization, Web, etc.
Nevertheless, there are situations when other tools are needed:
0.2.2 Input and output of spatial data
Reading spatial layers from a file into an R data structure, or writing the R data structure into a file, are handled by external libraries:
- GDAL/OGR is used for reading/writing vector and raster files, with
sfandstars - PROJ is used for handling CRS, in both
sfandstars - Working with specialized formats, e.g., HDF with
gdalUtilsor NetCDF withncdf4
Package sf combined with RPostgreSQL can be used to read from, and write to, a PostGIS spatial database:
0.2.3 sf: Processing Vector Layers
GEOS is used for geometric operations on vector layers with sf:
- Numeric operators—Area, Length, Distance…
- Logical operators—Contains, Within, Within distance, Crosses, Overlaps, Equals, Intersects, Disjoint, Touches…
- Geometry generating operators—Centroid, Buffer, Intersection, Union, Difference, Convex-Hull, Simplification…
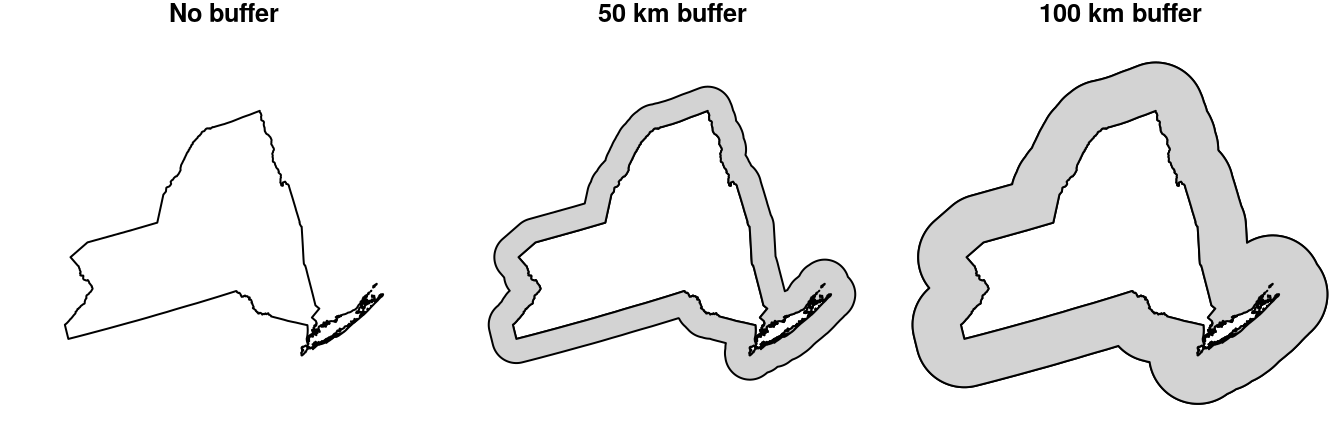
Figure 0.6: Buffer function
0.2.4 stars: Processing Rasters
Geometric operations on rasters can be done with package stars:
- Accessing cell values—As matrix / array, Extracting to points / lines / polygons
- Raster algebra—Arithmetic (
+,-, …), Math (sqrt,log10, …), logical (!,==,>, …), summary (mean,max, …), Masking - Changing resolution and extent—Cropping, Mosaic, Resampling, Reprojection
- Transformations—Raster <-> Points / Contour lines / Polygons
0.2.5 geosphere: Geometric calculations on longitude/latitude
Package geosphere implements spherical geometry functions for distance- and direction-related calculations on geographic coordinates (lon-lat)
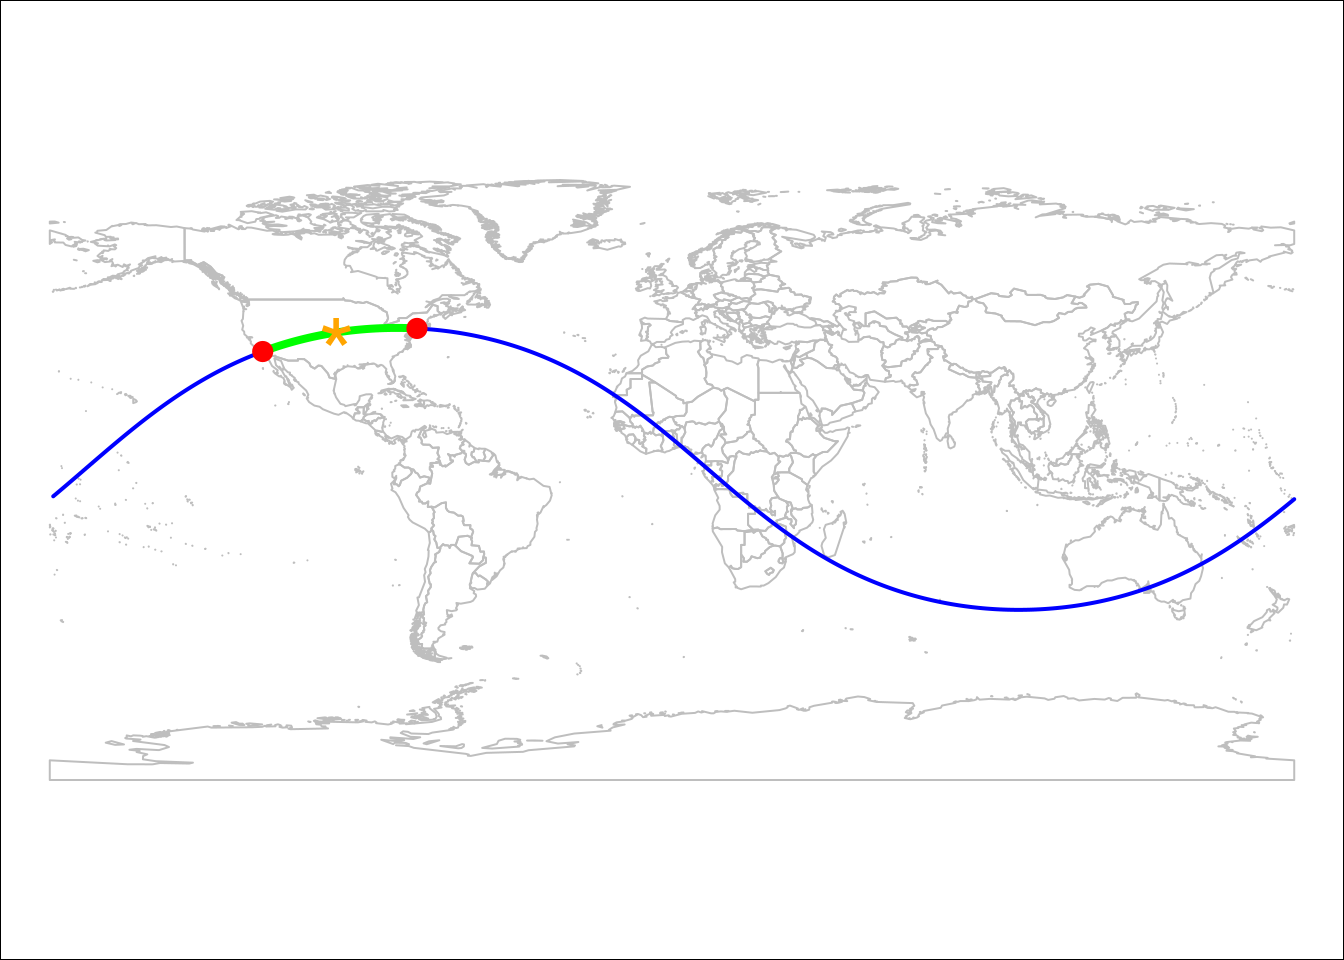
Figure 0.7: Points on Great Circle
![Visualizing Facebook Friends with `geosphere`^[http://paulbutler.org/archives/visualizing-facebook-friends/]](images/facebook_map.png)
Figure 0.8: Visualizing Facebook Friends with geosphere8
0.2.6 gstat: Geostatistical Modelling
Univariate and multivariate geostatistics:
- Variogram modelling
- Ordinary and universal point or block (co)kriging
- Cross-validation
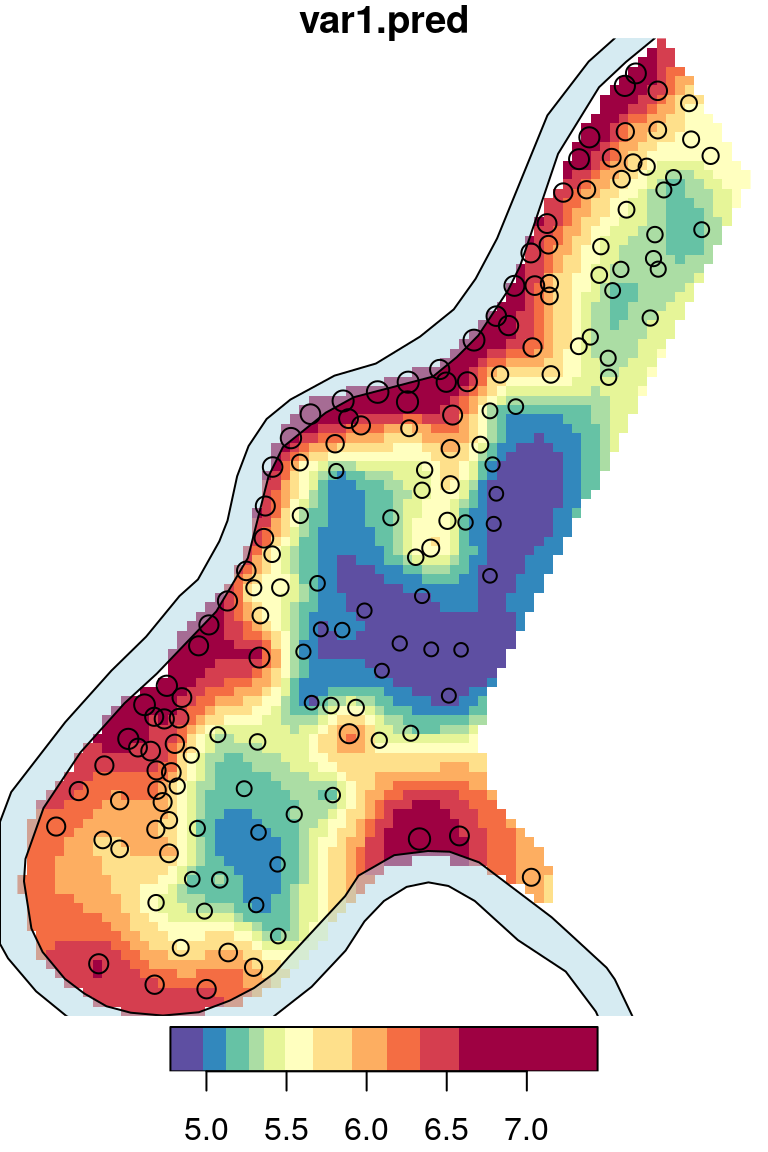
Figure 0.9: Predicted Zinc concentration, using Ordinary Kriging
0.2.7 spdep: Spatial dependence modelling
Modelling with spatial weights:
- Building neighbor lists and spatial weights
- Tests for spatial autocorrelation for areal data (e.g., Moran’s I)
- Spatial regression models (e.g., SAR, CAR)
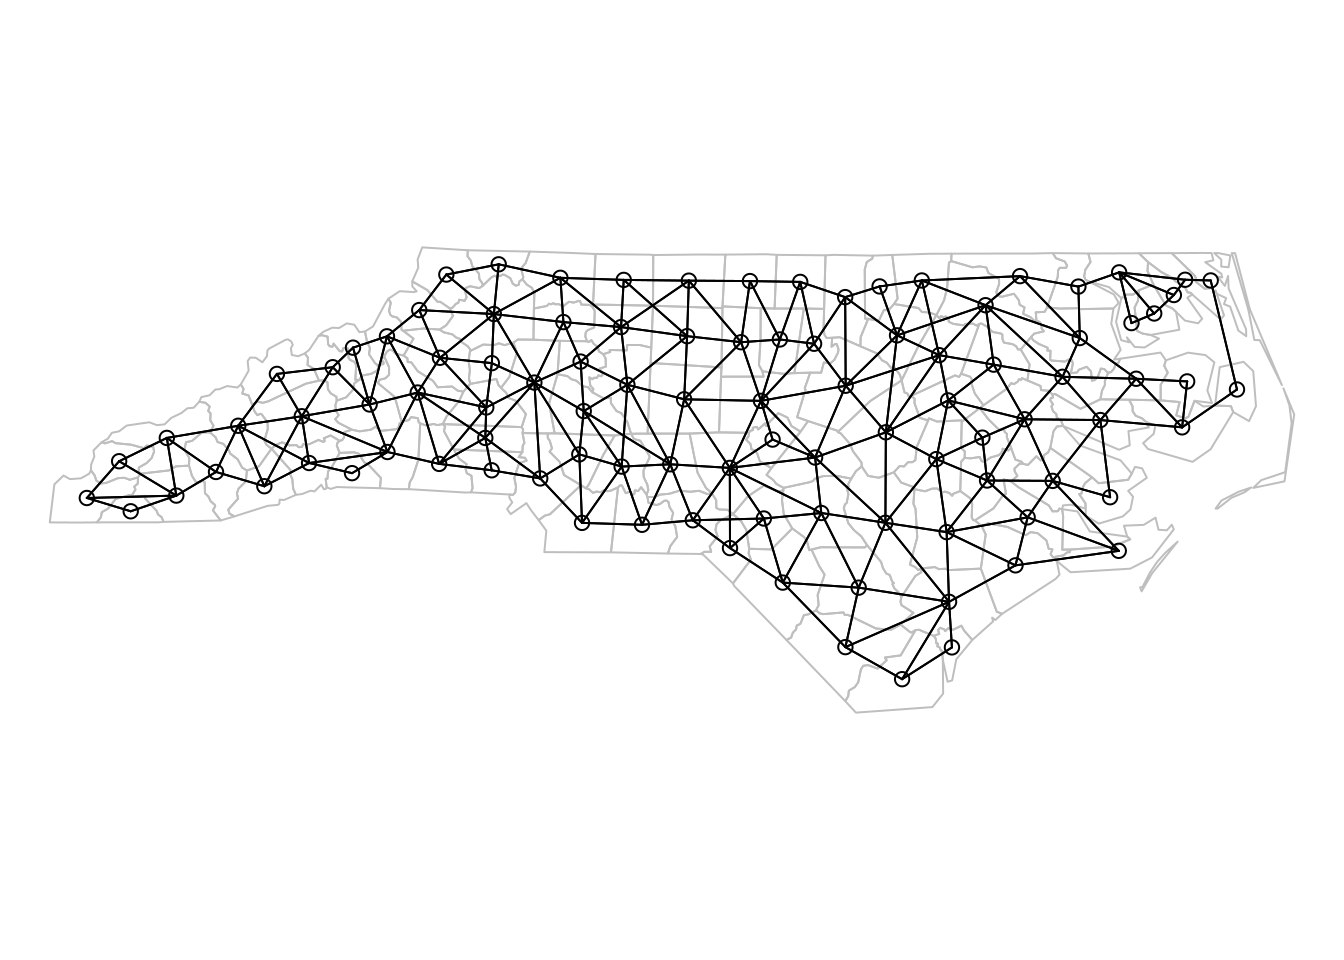
Figure 0.10: Neighbours list based on regions with contiguous boundaries
0.2.8 spatstat: Spatial point pattern analysis
Techniques for statistical analysis of spatial point patterns, such as:
- Kernel density estimation
- Detection of clustering using Ripley’s K-function
- Spatial logistic regression
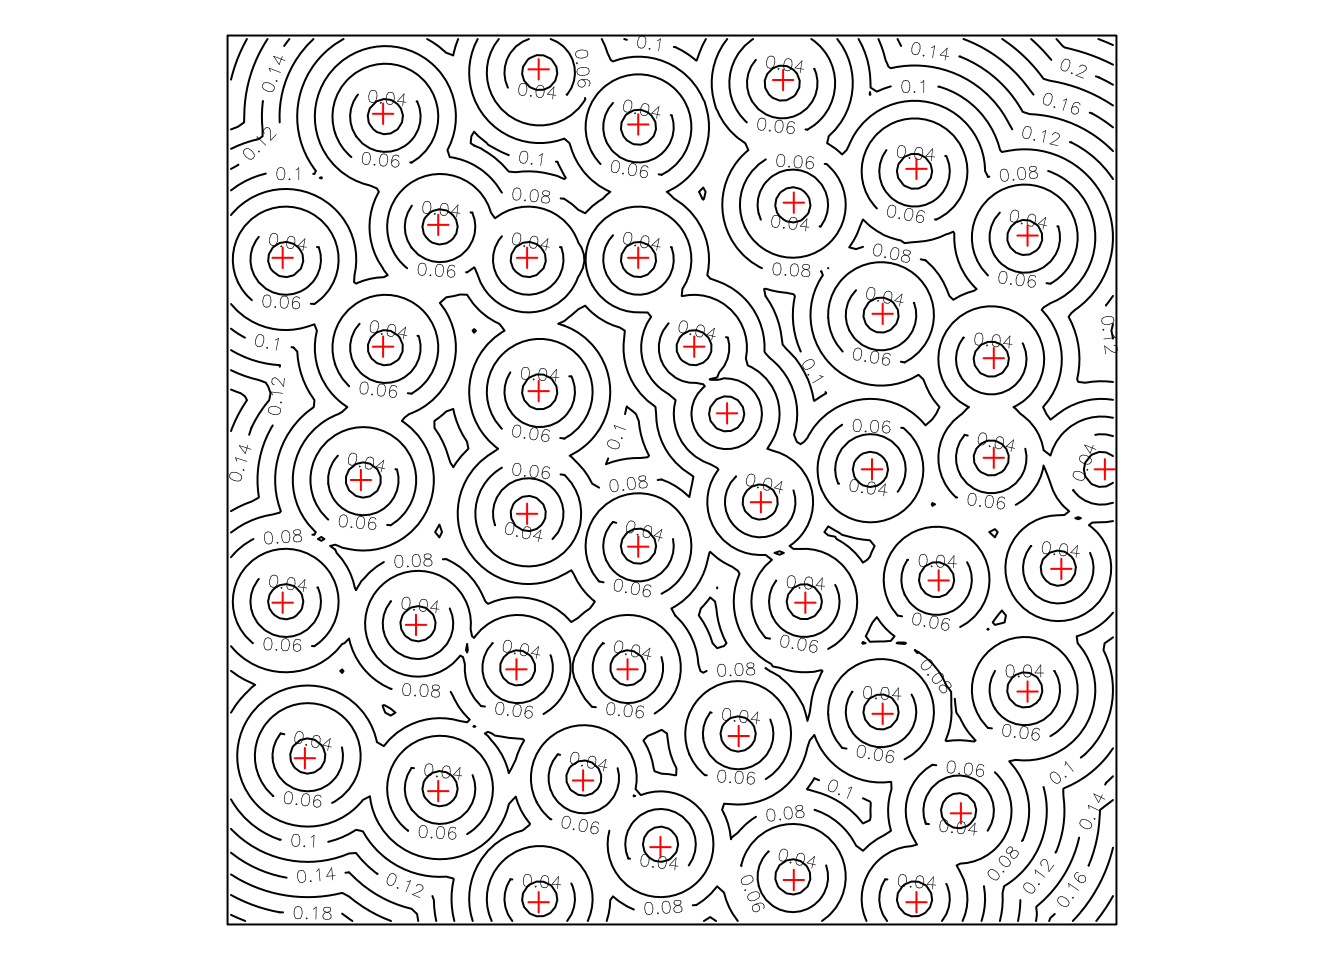
Figure 0.11: Distance map for the Biological Cells point pattern dataset
0.2.9 osmdata: Access to OpenStreetMap data
Accessing OpenStreetMap (OSM) data using the Overpass API9
library(sf)
library(osmdata)
q = opq(bbox = "Beer-Sheva, Israel")
q = add_osm_feature(q, key = "highway")
dat = osmdata_sf(q)
lines = dat$osm_lines
pol = dat$osm_polygons
pol = st_cast(pol, "MULTILINESTRING")
pol = st_cast(pol, "LINESTRING")
lines = rbind(lines, pol)
lines = lines[, c("osm_id", "highway")]
lines = st_transform(lines, 32636)
plot(lines)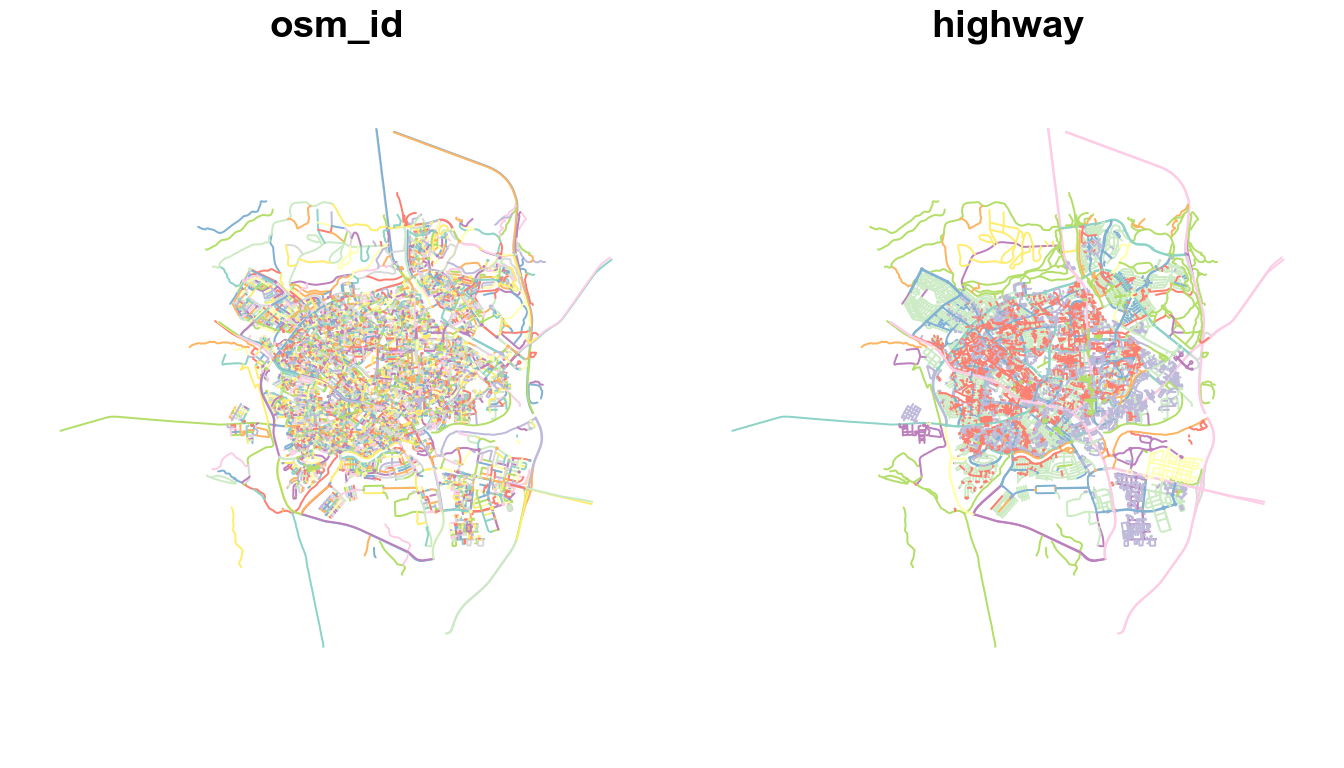
Figure 0.12: Beer-Sheva road network data from OpenStreetMap (OSM)
0.2.10 ggplot2, ggmap: Visualization
![London cycle hire journeys with `ggplot2`^[http://spatial.ly/2012/02/great-maps-ggplot2/]](images/bike_ggplot.png)
Figure 0.13: London cycle hire journeys with ggplot210
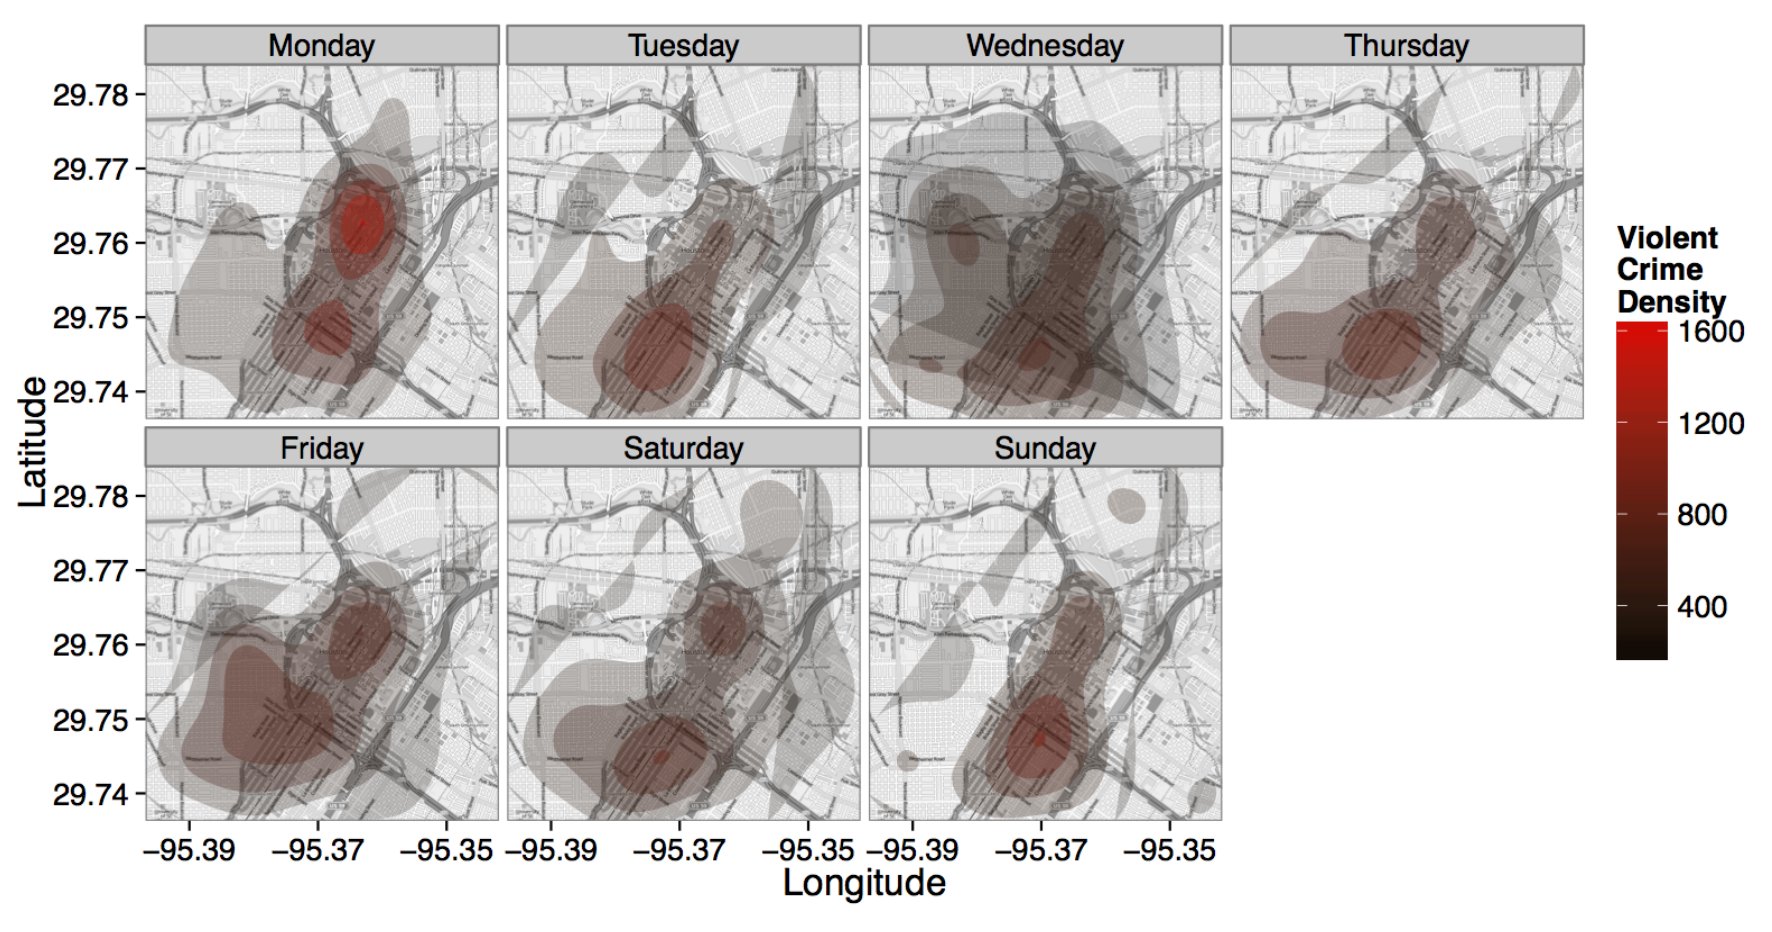
Figure 0.14: Crime density by day with ggplot2
0.2.11 leaflet, mapview: Web mapping
Packages leaflet and mapview provide methods to produce interactive maps using the Leaflet JavaScript library.
![]()
Package leaflet gives more low-level control. Package mapview is a wrapper around leaflet, automating addition of useful features:
- Commonly used basemaps
- Color scales and legends
- Labels
- Popups
Function mapview produces an interactive map given a spatial object:
zcol="..."specifies the attribute used for symbologylegend=TRUEadds a legend
library(sf)
library(mapview)
states = st_read("_book/data/USA_2_GADM_fips.shp")
mapview(states, zcol = "NAME_1", legend = TRUE)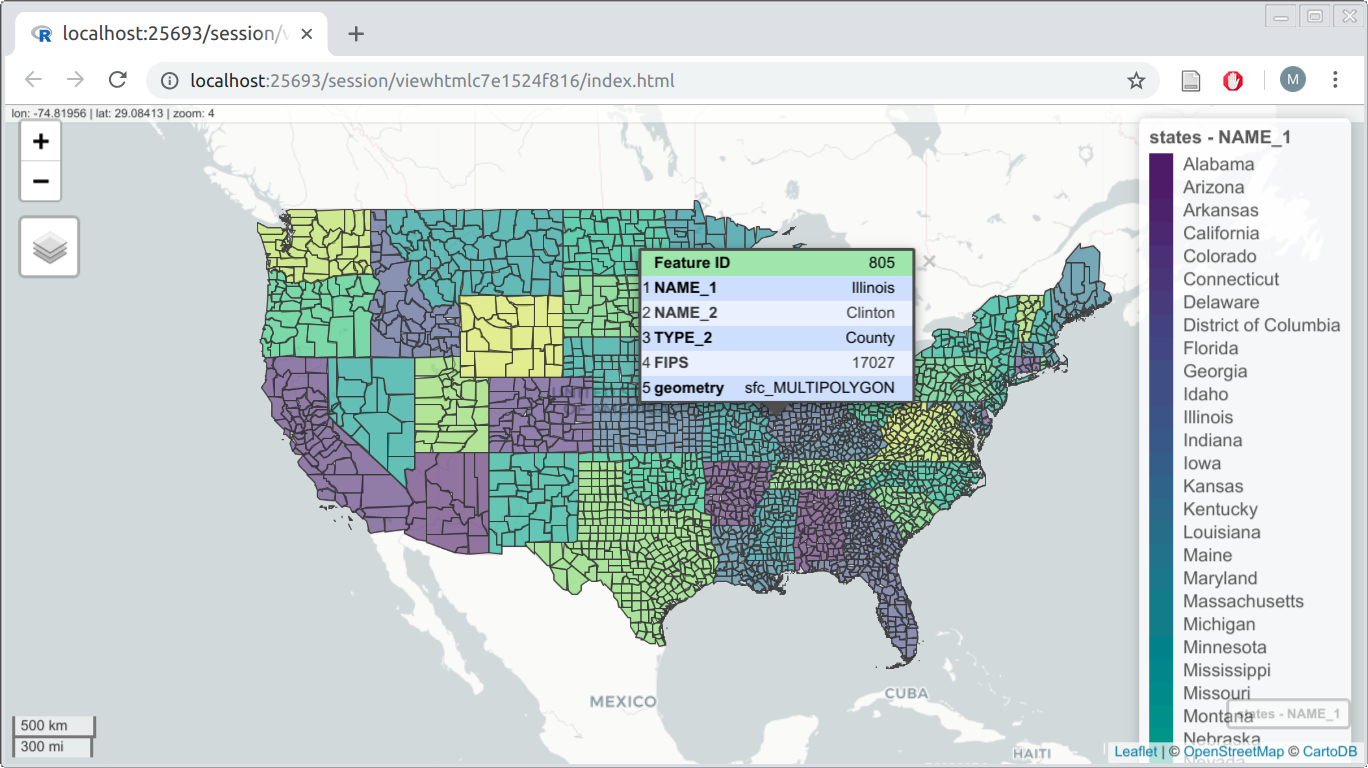
Figure 0.15: Intractive map made with mapview
0.3 Other materials
0.3.1 Books
- Model-based Geostatistics (2007)
- A Practical Guide to Geostatistical Mapping (2009)
- Spatial Data Analysis in Ecology and Agriculture using R (2012)
- Learning R for Geospatial Analysis (2014)
- Applied Spatial Data Analysis with R (1st ed. 2008, 2nd ed. 2013)
- Hierarchical Modeling and Analysis for Spatial Data (1st ed. 2003, 2nd ed. 2014)
- An Introduction to R for Spatial Analysis and Mapping 1st ed. 2015, 2nd ed. 2018)
- Spatial Point Patterns: Methodology and Applications with R (2015)
- Displaying Time Series, Spatial, and Space-Time Data with R (1st ed. 2014, 2nd ed. 2018)
- Predictive Soil Mapping with R (2019)
- Geocomputation with R (2019)
- Spatial Data Science (2020?)
0.3.2 Papers
0.3.3 Courses and tutorials
0.3.3.1 Courses
- GEOG 4/595: Geographic Data Analysis
- CP6521 Advanced GIS
- ES214 Introduction to GIS and Spatial Analysis
- GEOG 4/590: R for Earth-System Science
- GEOG 4/595: Geographic Data Analysis
- Spatial Data Science with R (Robert J. Hijmans)
- Introduction to Spatial Data Programming with R (this course)
- GISC 422 Spatial Analysis and Modelling
- CASA0005 Geographic Information Systems and Science
- Another list here
0.3.3.2 Tutorials
0.3.3.3 Presentations
0.3.3.4 Official materials
Comprehensive R Archive Network↩
https://spectrum.ieee.org/computing/software/the-top-programming-languages-2019↩
https://www.nature.com/news/programming-tools-adventures-with-r-1.16609↩
https://cran.r-project.org/web/packages/sf/vignettes/sf2.html#reading_and_writing_directly_to_and_from_spatial_databases↩
http://paulbutler.org/archives/visualizing-facebook-friends/↩