G Exercise 05
Last updated: 2020-08-12 00:41:51
G.1 Question 1
- Recall that the
get_neighborsandfocal2functions from Section 9.4, which we used to apply a focal filter. Thefocal2function excludes the first and last rows and columns (Figure G.1).

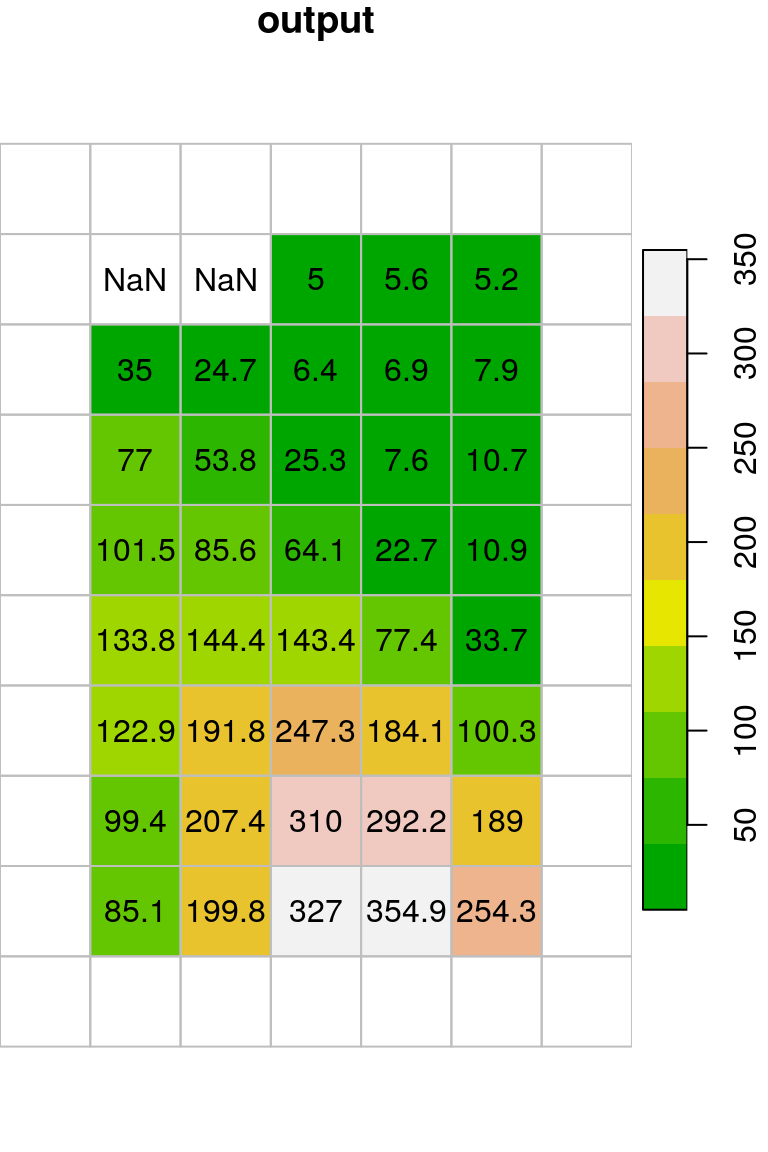
Figure G.1: Original mean filter applied on dem.tif
- Modify the definitions of the
get_neighborsand/orfocal2functions from Section 9.4, so that the first and last rows and columns are also processed, even though they have incomplete neighbornoods. This means that for focal cells in the first or last row/column, the function shoud be applied on the available values plusNAvalues for the “missing” neighbors. For example, for the pixel in row 8 column 1 ofdem.tif, the \(3\times 3\) neighborhood consists of five non-NAvalues plus fourNAvalues (Figure G.2).
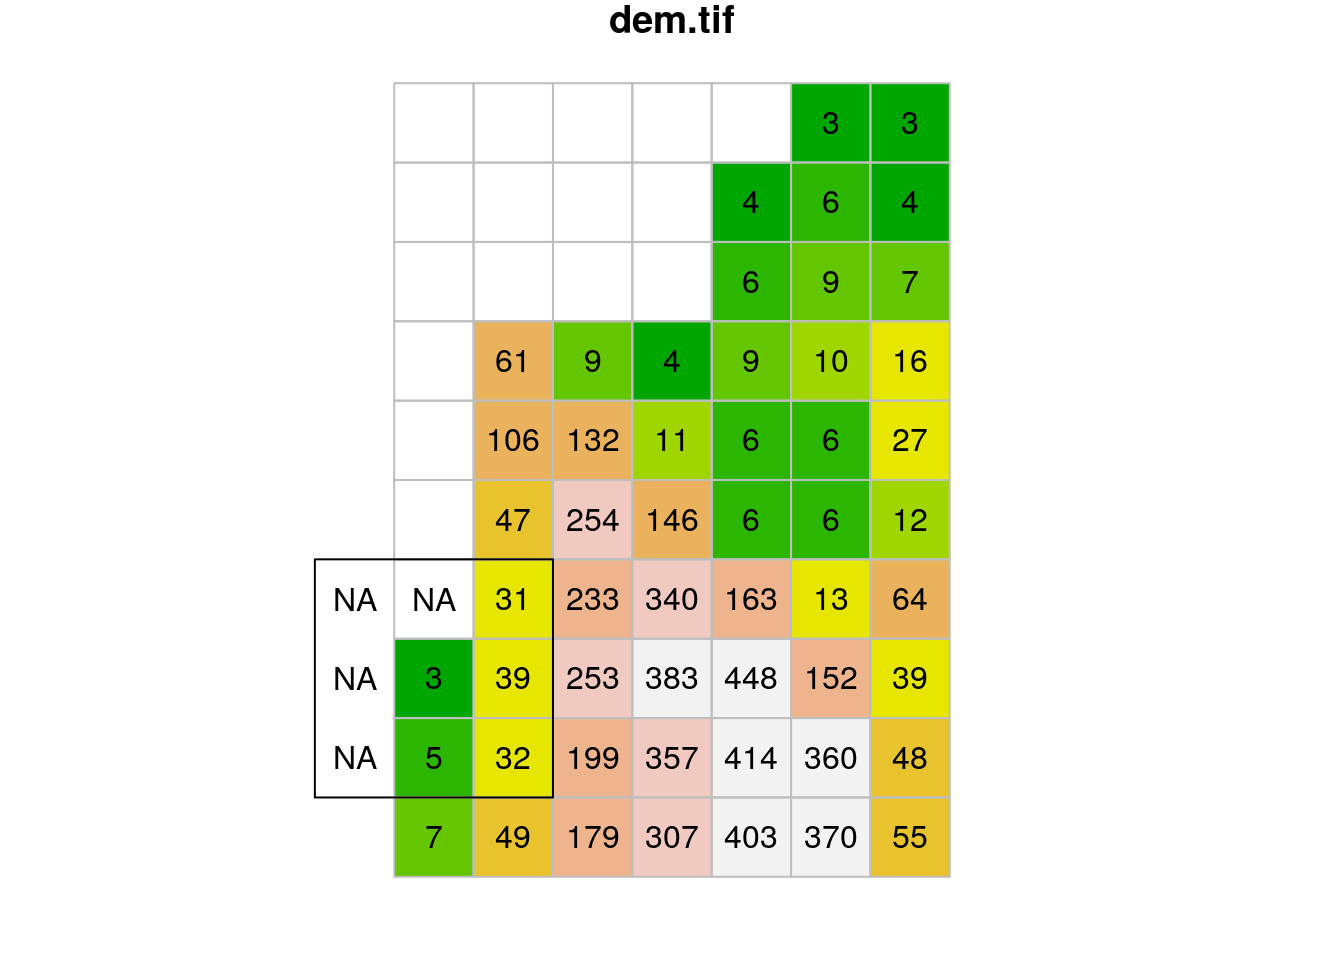
Figure G.2: Neighborhood around a corner pixel in a raster
- Apply the modified filter with the
meanfunction andna.rm=TRUEon thedem.tifraster. - Plot the resulting raster, including rounded values, as shown in the right panel of (Figure G.3).
- Hint: there are (at least) two ways to solve this exercise: (1) modify the
get_neighborsfunction so that if the position is on matrix edges then the values are only extracted from intact cells, or (2) temporarily add a “buffer” ofNAvalues on all sides of the matrix with the raster values, apply the filter on the expanded matrix, then discard the buffer.
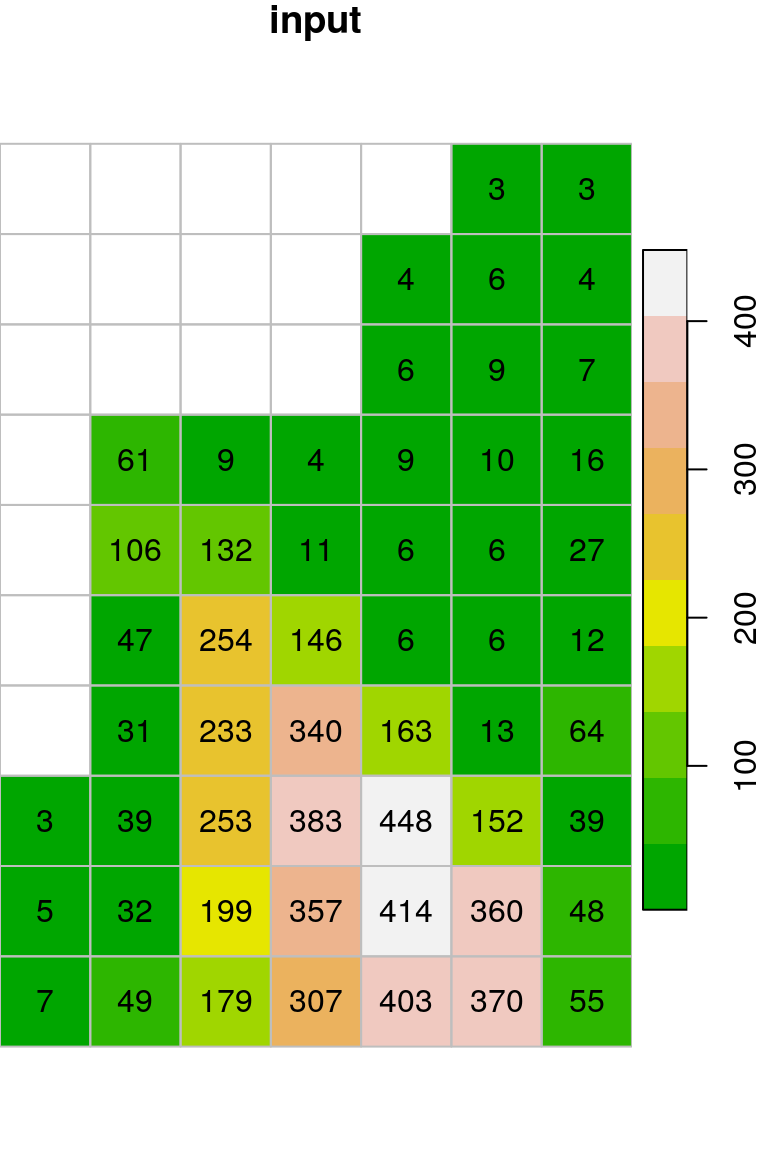
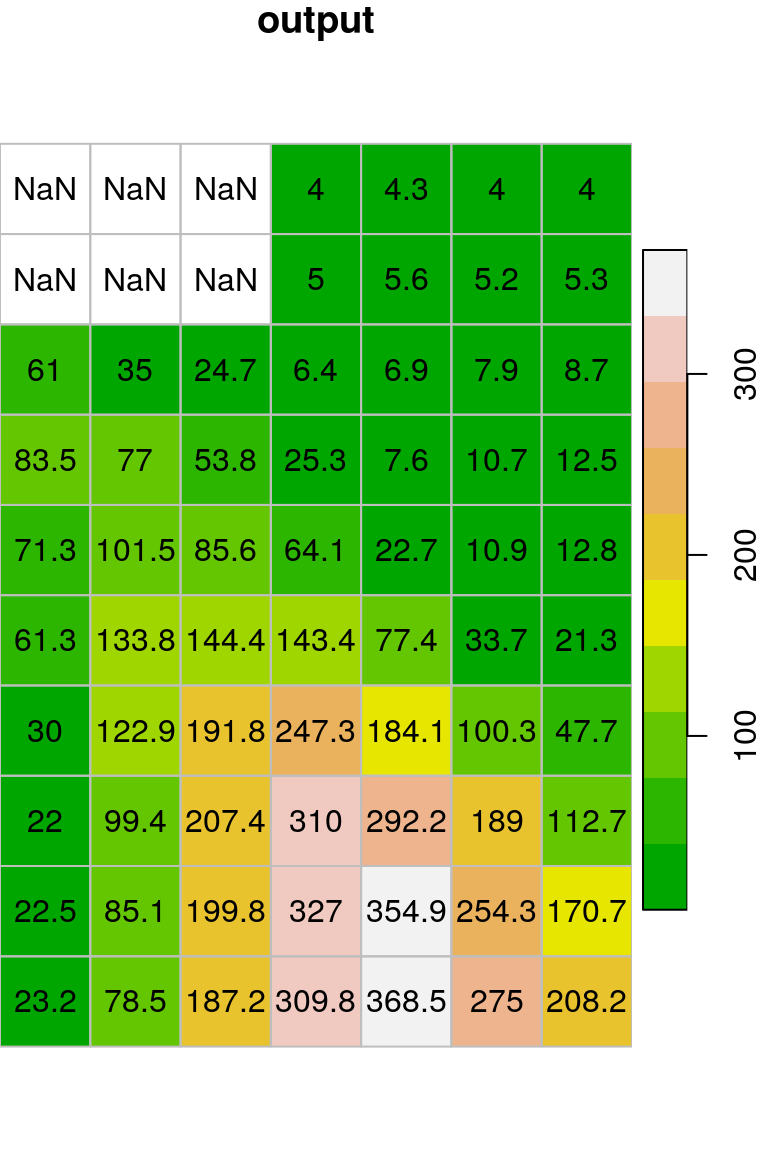
Figure G.3: Modified mean filter applied on dem.tif
(50 points)
G.2 Question 2
- Read the
MOD13A3_2000_2019.tifraster, with monthly NDVI values, into astarsobject namedr. - Reproject
rto UTM withst_warp(r, crs = 32636). - Read the Shapefile named
nafot.shp, which includes polygons of “Nafa” administrative regions in Israel, and reproject it to UTM as well. - Subset the three polygons where
name_engis one of:"Be'er Sheva","Zefat","Tel Aviv". - Calculate the average NDVI for each of the three polygons for each date.
- Plot the resulting three time series, as shown in Figure G.4. Note that all values should fit into the plot ares, the x-axis should display the dates (based on
MOD13A3_2000_2019_dates.csv) and the series should be labeled with text labels.
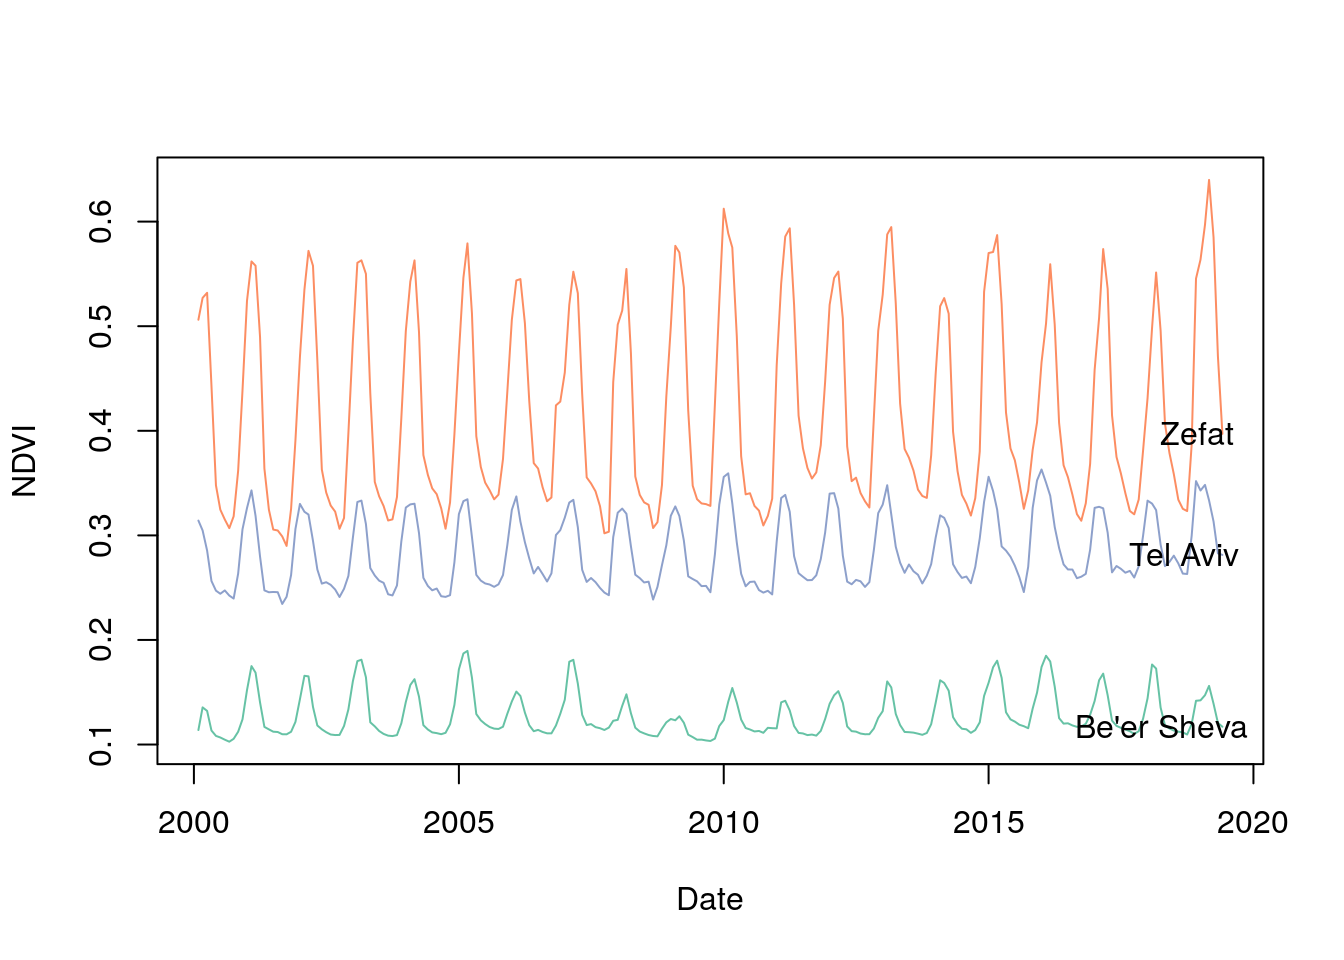
Figure G.4: NDVI time series in three “Nafa” polygons
(50 points)