H Exam
Last updated: 2025-02-06 09:34:06
H.1 Course grade
- Exercises (50%)
- Exam (50%)
- The exam is composed of 12 multiple-choice questions. There is exactly one right answer to each question.
- Exam duration is 2 hours.
- Permitted exam equipment: a calculator.
- The exam takes place in a regular class, with pen and paper (not in front of a computer).
- Each question contains a short code section. The code section is not identical to the ones that appeared in the course materials, but they combine functions and methods which were learned. You need to choose the right code output out of 4 options.
H.2 Material for exam
The material for the exam is Chapters 1–10, except for:
- Dates (
Date) - Chapter 9
Note that two functions named st_mosaic and st_warp appear in the data preparation steps in Chapter 10, however these functions are covered in Chapter 9 and therefore will not appear in the exam.
H.3 Examples of exam questions
H.3.5 Question 5
(A) [1] FALSE FALSE FALSE FALSE
(B) [1] TRUE FALSE FALSE FALSE
(C) [1] TRUE TRUE FALSE FALSE
(D) [1] TRUE TRUE TRUE FALSE
H.3.6 Data for questions 6-9
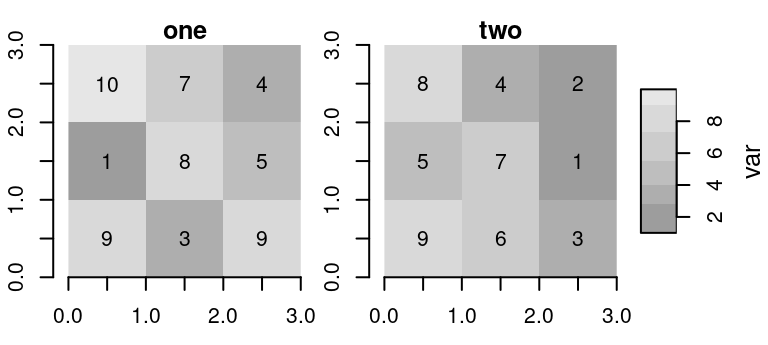
For questions 6-9 we define a stars raster named r, and an sf point layer named pnt:
library(stars)
v = c(10,7,4,1,8,5,9,3,9,8,4,2,5,7,1,9,6,3)
a = array(v, dim = c(3, 3, 2))
r = st_as_stars(a)
r = st_set_dimensions(r, names = c('x', 'y', 'layer'))
r = st_set_dimensions(r, 'y', delta = -1, offset = 3)
r = st_set_dimensions(r, 'y', point = FALSE)
r = st_set_dimensions(r, 'layer', values = c('one', 'two'))
names(r) = 'var'
r
## stars object with 3 dimensions and 1 attribute
## attribute(s):
##      Min. 1st Qu. Median     Mean 3rd Qu. Max.
## var     1    3.25    5.5 5.611111       8   10
## dimension(s):
##       from to offset delta point   values x/y
## x        1  3      0     1 FALSE     NULL [x]
## y        1  3      3    -1 FALSE     NULL [y]
## layer    1  2     NA    NA FALSE one, two
pnt = data.frame(x = c(1.6, 0.2), y = c(1.7, 2.6), z = c(80, 90))
pnt = st_as_sf(pnt, coords = c('x', 'y'))You can also learn about the structure of r from the following plot.
H.3.11 Data for questions 10-11
For questions 10-11 we will define two data.frame objects named animals and types:
H.3.13 Question 11
(A) [1] "cat cat" "sparrow cat" "turtle cat"
(B) [1] "sparrow sparrow"
(C) [1] "sparrow"
(D) [1] "sparrow cat"
H.3.16 Data for questions 14-15
For questions 14-15 we will define a data.frame object named cars. (All columns are numeric.)
cars = mtcars[1:10, 1:4]
cars
##                    mpg cyl  disp  hp
## Mazda RX4         21.0   6 160.0 110
## Mazda RX4 Wag     21.0   6 160.0 110
## Datsun 710        22.8   4 108.0  93
## Hornet 4 Drive    21.4   6 258.0 110
## Hornet Sportabout 18.7   8 360.0 175
## Valiant           18.1   6 225.0 105
## Duster 360        14.3   8 360.0 245
## Merc 240D         24.4   4 146.7  62
## Merc 230          22.8   4 140.8  95
## Merc 280          19.2   6 167.6 123
H.3.17 Question 14
x = rep(NA, 3)
cyl = c(4, 6, 8)
for(i in 1:length(cyl)) {
  x[i] = which.min(cars[cars$cyl == cyl[i], "hp"])
}
x(A) [1] 2 4 1
(B) [1] 8 6 5
(C) [1] 2 4 6
(D) [1] 62 105 175