F Exercise 04
Last updated: 2025-02-06 09:33:52
F.2 Question 1
- Load the built-in
data.frameobject namedworld.citiesfrom themapspackage, as follows:
library(maps)
head(world.cities)
##                 name country.etc   pop   lat  long capital
## 1 'Abasan al-Jadidah   Palestine  5629 31.31 34.34       0
## 2 'Abasan al-Kabirah   Palestine 18999 31.32 34.35       0
## 3       'Abdul Hakim    Pakistan 47788 30.55 72.11       0
## 4 'Abdullah-as-Salam      Kuwait 21817 29.36 47.98       0
## 5              'Abud   Palestine  2456 32.03 35.07       0
## 6 'Abwein Palestine 3434 32.03 35.20 0- The
world.citiesobject is a table with information about world cities. The table includes the longitude and latitude of each city in thelongandlatcolumns, respectively. - Choose a city which starts with the same letter as your first name. (In your code, you can use the city name and the country name for subsetting.)
- Find the 5 nearest cities (excluding self) to the city you selected. (Hint: use
st_distanceto find the distances to all cities, then sort the cities by distance.) - Plot (Figure F.1):
- the selected city,
- the five other nearest cities,
- labels with the city names, and
- a convex hull polygon of all 6 cities combined.
- Use
axes=TRUEto show the axis coordinates in the plot.
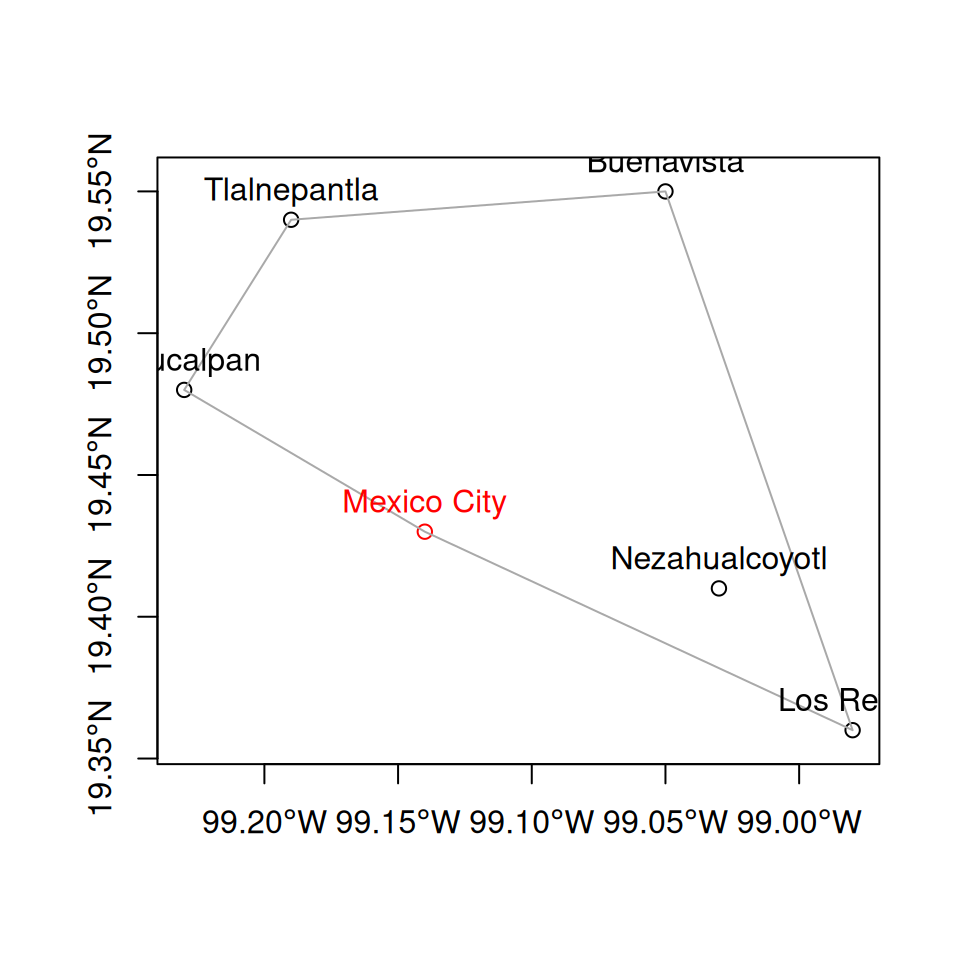
Figure F.1: Mexico City and five nearest other cities
(50 points)
F.3 Question 2
- Load the built-in
data.frameobject namedworld.citiesfrom themapspackage, as follows:
library(maps)
head(world.cities)
##                 name country.etc   pop   lat  long capital
## 1 'Abasan al-Jadidah   Palestine  5629 31.31 34.34       0
## 2 'Abasan al-Kabirah   Palestine 18999 31.32 34.35       0
## 3       'Abdul Hakim    Pakistan 47788 30.55 72.11       0
## 4 'Abdullah-as-Salam      Kuwait 21817 29.36 47.98       0
## 5              'Abud   Palestine  2456 32.03 35.07       0
## 6 'Abwein Palestine 3434 32.03 35.20 0- The
world.citiesobject is a table with information about world cities. The table includes the longitude and latitude of each city in thelongandlatcolumns, respectively. - Read the Shapefile named
nafot.shp, which includes polygons of “Nafa” administrative regions in Israel - Subset those cities which intersect with the “Nafa” polygons
- Calculate the average population density (people per \(km^2\)) per “Nafa” polygon, i.e., the sum of the
'pop'column of all cities falling into each “Nafa”, divided by the area of the “Nafa” in \(km^2\) - Plot the population densities using a color scale, as shown in Figure F.2
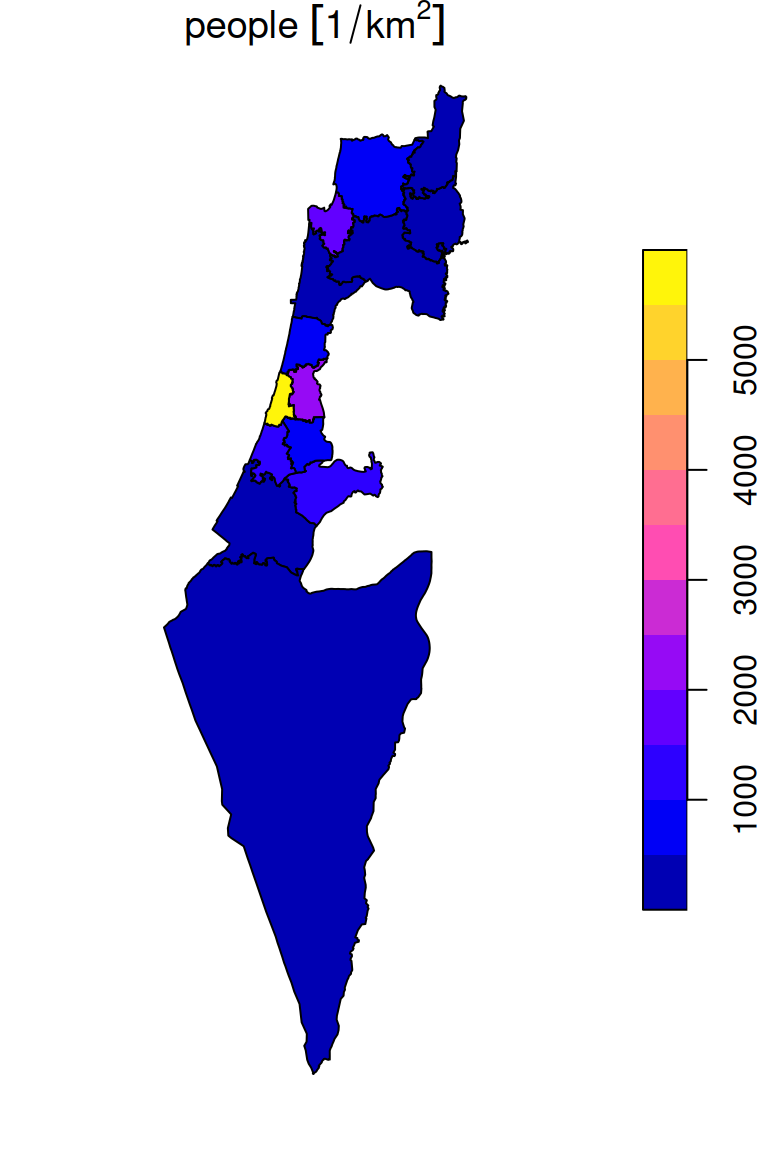
Figure F.2: Average population density (\(1/km^2\)) in each “Nafa”
(50 points)