D Exercise 02
Last updated: 2025-02-06 09:33:44
D.2 Question 1
- Read the
rainfall.csvfile into adata.frameobject. - Calculate and print a vector with the station names where at least one of the months has >200 mm of rainfall.
## [1] "Golan Farm" "Eilon"      "Fasutta"    "Yehiam"     "Kfar Mahol"
## [6] "Meron" "Horashim"- You can define and use the vector
mwith month names in your code, to subset the columns with monthly rainfall amounts, as shown in Section 4.4.3:
(50 points)
D.3 Question 2
- Create the
valueandtimevectors representing the Kinneret water level time series in November and May during 1991-2011, using the expressions from Section 3.1.3 - Calculate the consecutive differences between the current time and the previous one (i.e., water level change in the last 6-months)
- Plot the two separate time series of 6-month differences in November and in May (i.e., the rises in water level over winter, and the drops in water level over summer) (Figure D.1)
- Add a horizontal line marking \(y=0\) (Figure D.1)
- Add text labels marking the location and value of the minimum and maximum differences (i.e., the two most extreme water level changes) (Figure D.1)
- Don’t type any specific values such as
25,36,4.6,-2.05,'2008-11-15', and'2003-05-15'in your code! Use the right expressions to calculate them.
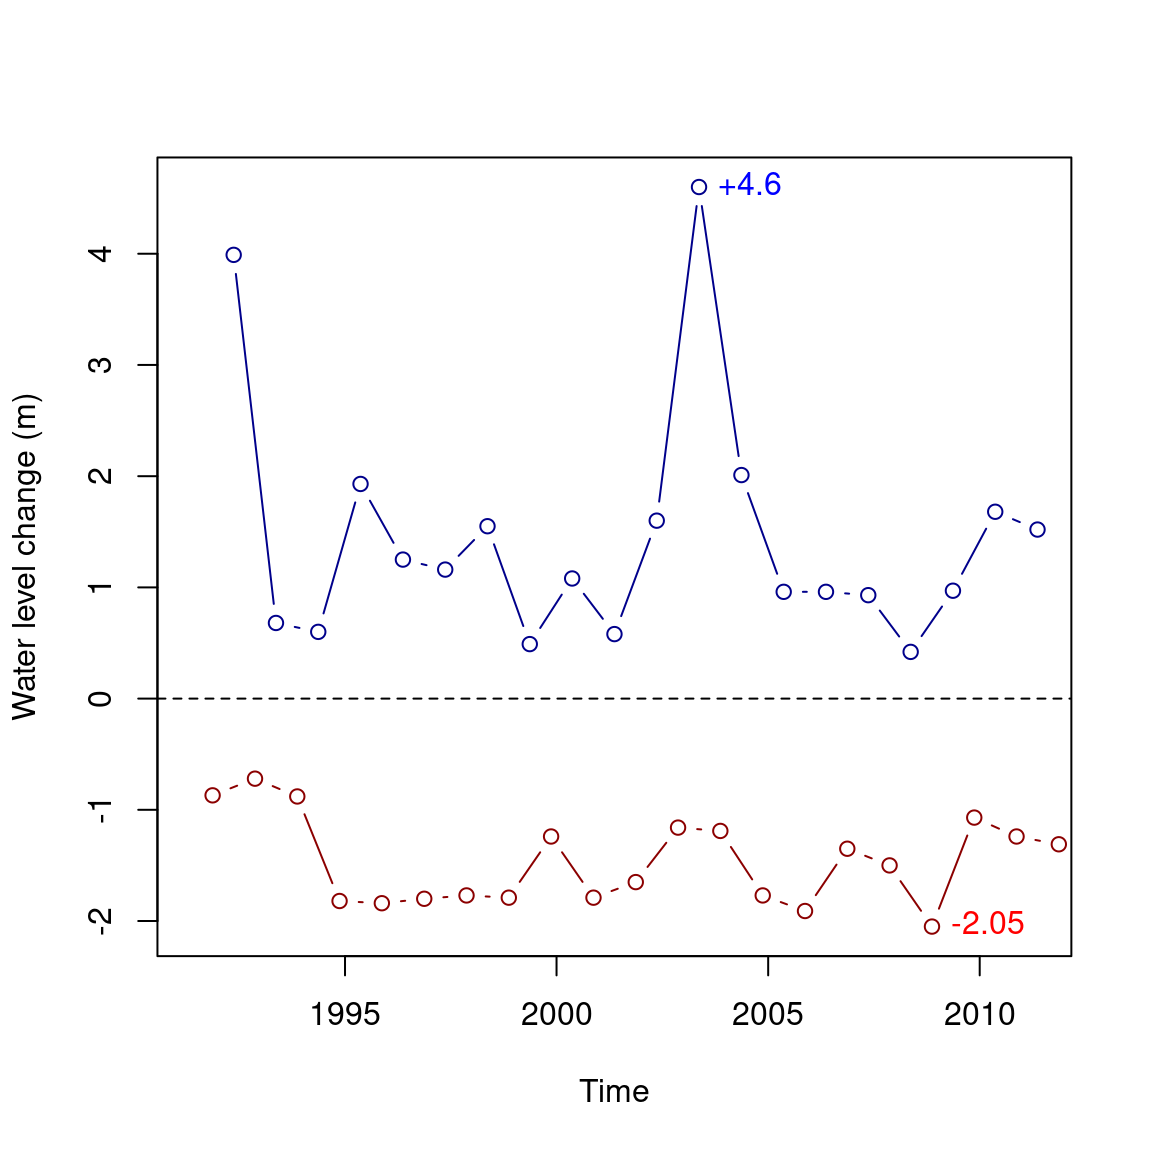
Figure D.1: Water level change of lake Kinneret in May and November over time
(50 points)