E Exercise 03
Last updated: 2025-02-06 09:33:45
E.2 Question 1
- Read the raster
MOD13A3_2000_2019.tifto a multi-band raster object namedr. - Calculate a vector of length 24 with the correlation coefficients between the values of the layer 1, and the values of layers 1, 2, …, 24.
- To calculate correlation coefficients use the
corfunction with theuse='pairwise.complete.obs'argument, as in:cor(x, y, use='pairwise.complete.obs'). - For example, the 2nd value in the vector should be equal to:
## [1] 0.9752619- Plot the values of the vector, as shown in Figure E.1.
- Note: the two arguments passed to the
corfunction, i.e., the pixel values of layer 1 and layer n, need to be either vectors or arrays (not matrices). If necessary, amatrixcan be converted to a vector withas.vector.
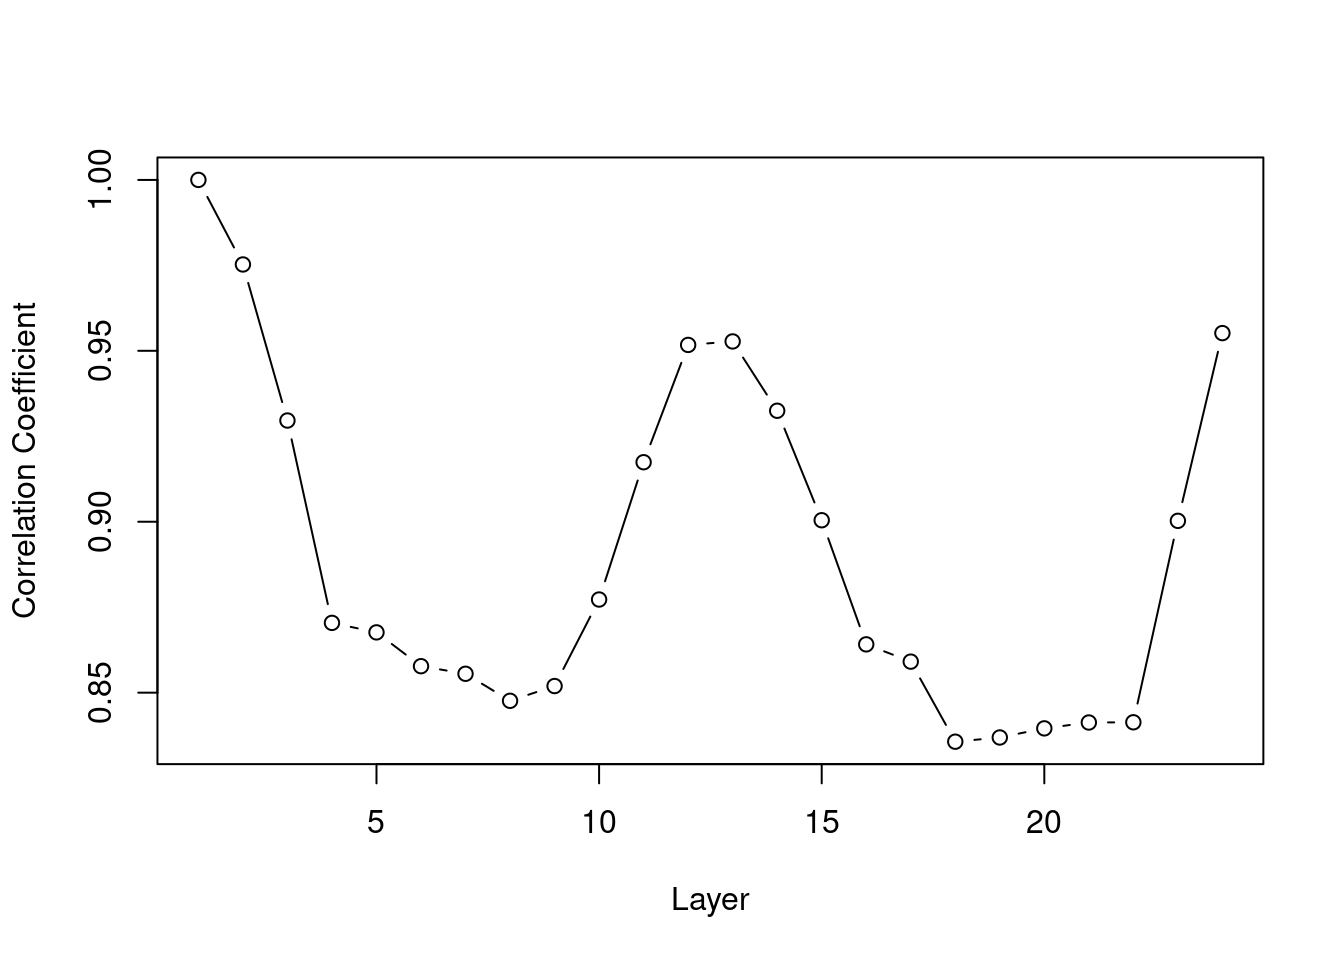
Figure E.1: Correlation between NDVI values in layer 1 and layers 1-24
(50 points)
E.3 Question 2
- Read the raster
MOD13A3_2000_2019.tifto a multi-band raster object namedr. - Create a single-band raster
s, marking areas with relatively high NDVI, relatively low NDVI, and large amount ofNA, as follows:- Pixels where the maximal non-
NANDVI value across all 233 bands ofris <0.6, will have a value of0ins - Pixels where the maximal non-
NANDVI value across all 233 bands ofris ≥0.6, will have a value of1ins - Pixels where the proportion of
NAvalues is >0.2 (regardless of NDVI values), will have a value ofNAins
- Pixels where the maximal non-
- Plot the raster
swith values of0marked in'orange'and values of1marked in'darkgreen'(values ofNAwill be transparent, by default)
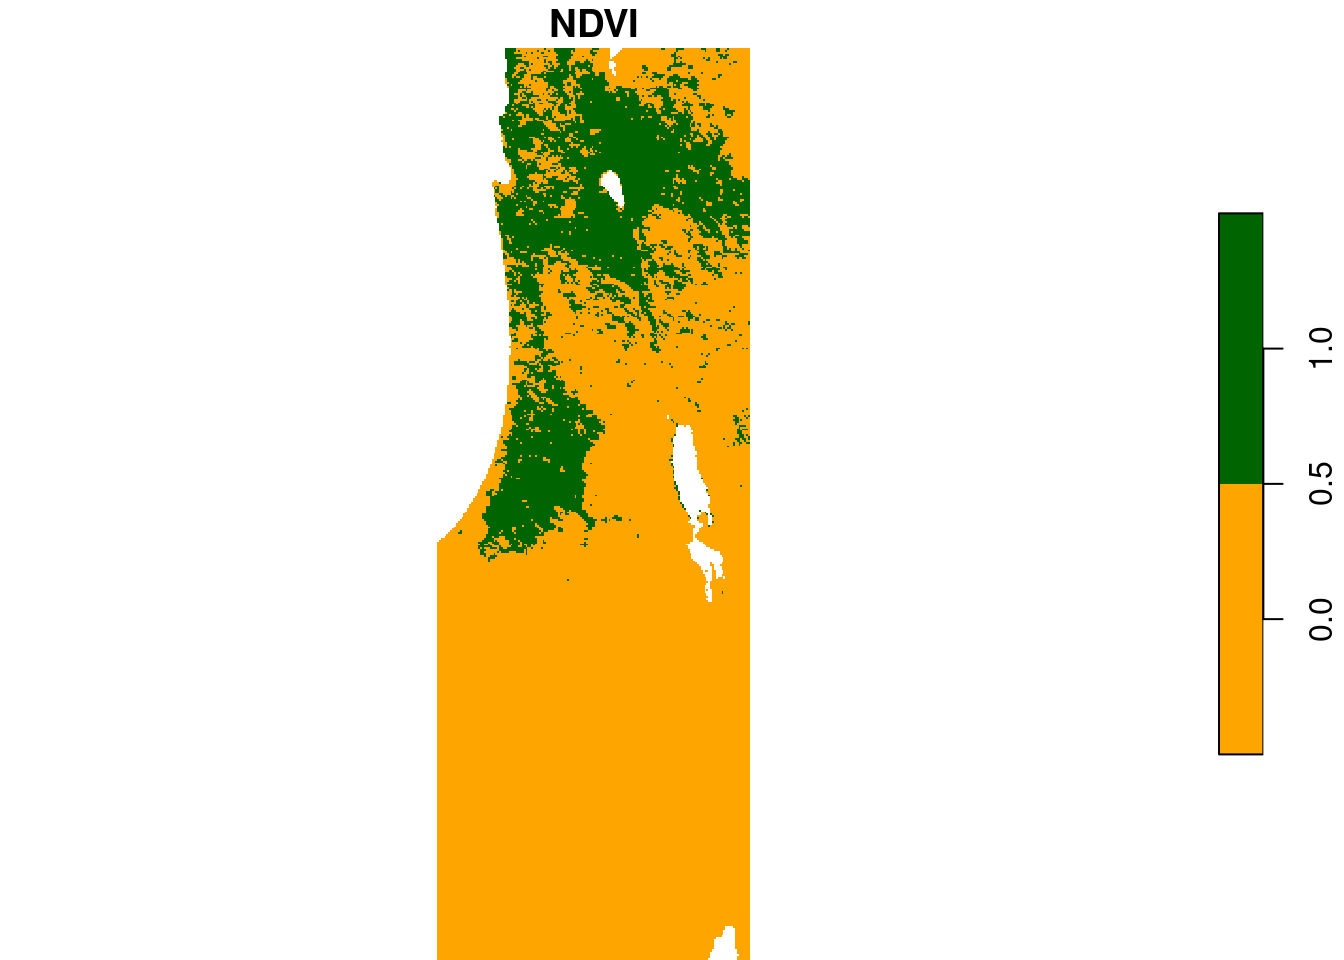
Figure E.2: \(NDVI_{max}≥0.6\) (green) and \(NDVI_{max}<0.6\) (orange)
(50 points)