H Exercise 06
Last updated: 2024-07-17 12:07:12
H.2 Question 1
- Read the
MOD13A3_2000_2019.tifraster to a multi-band raster object. This raster is a series of NDVI images from southern Israel. The date each layer refers to is recorded in the correspondingMOD13A3_2000_2019_dates.csvfile. - Calculate a 12-band raster that will contain the mean NDVI per pixel (excluding
NA) for each month. The first band will contain the mean values per pixel in all images taken in January, the second band will contain the mean values per pixel in all images taken in February, and so on. Use corresponding theMOD13A3_2000_2019_dates.csvtable to determine the layers corresponding to each month. - Plot the resulting raster as shown in Figure H.1 (including month names).
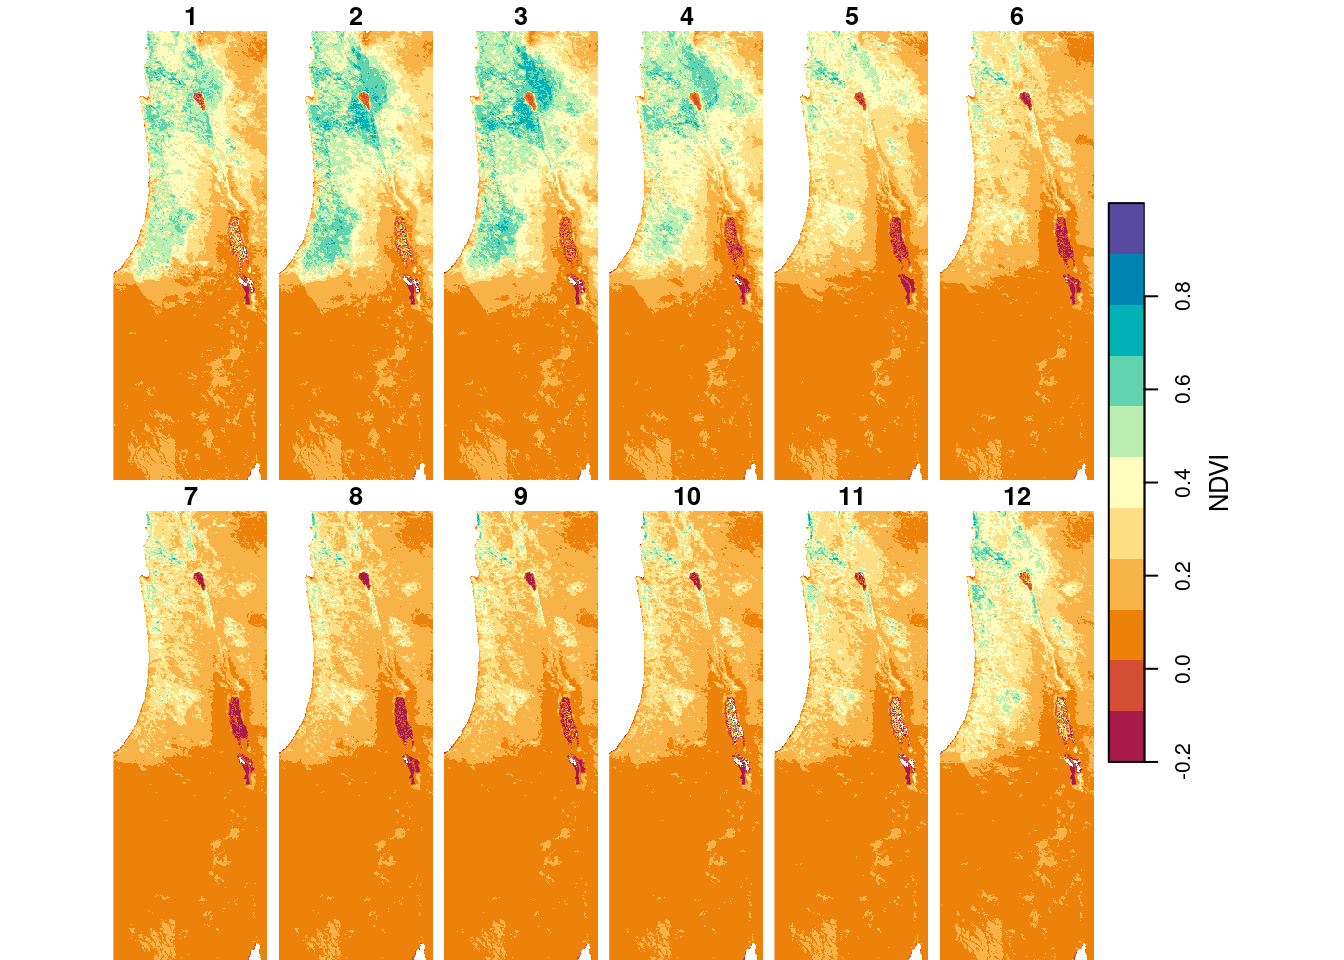
Figure H.1: Mean NDVI value per month in MOD13A3_2000_2019.tif
(50 points)
H.3 Question 2
- The following code creates a
data.framenamedelk_data:
library(moveHMM)
data(elk_data)
elk_data$ID = as.character(elk_data$ID)
head(elk_data)
##        ID Easting Northing dist_water
## 1 elk-115  769928  4992847     200.00
## 2 elk-115  766875  4997444     600.52
## 3 elk-115  765949  4998516     561.81
## 4 elk-115  765938  4998276     550.00
## 5 elk-115  766275  4998005     302.08
## 6 elk-115 766368 4998051 213.60- The
elk_datatable contains the locations (x=Easting, y=Northing, crs=32617) of four different animals (ID) (elks in Canada), as shown in the following map.
- Add the code section to load
elk_datain your exercise. - Create an
sfline layer with the trajectory of each animal (four features) and one attribute (theID). - Calculate the convex hull polygon of each animal trajectory.
- Plot the trajectories and the convex hull polygons, using a different color for each animal (Figure H.2). You can use
col=hcl.colors(4, "Dark 2")to plot the geometries with four different colors andlty=2to draw the convex hull polygons using dashed lines.
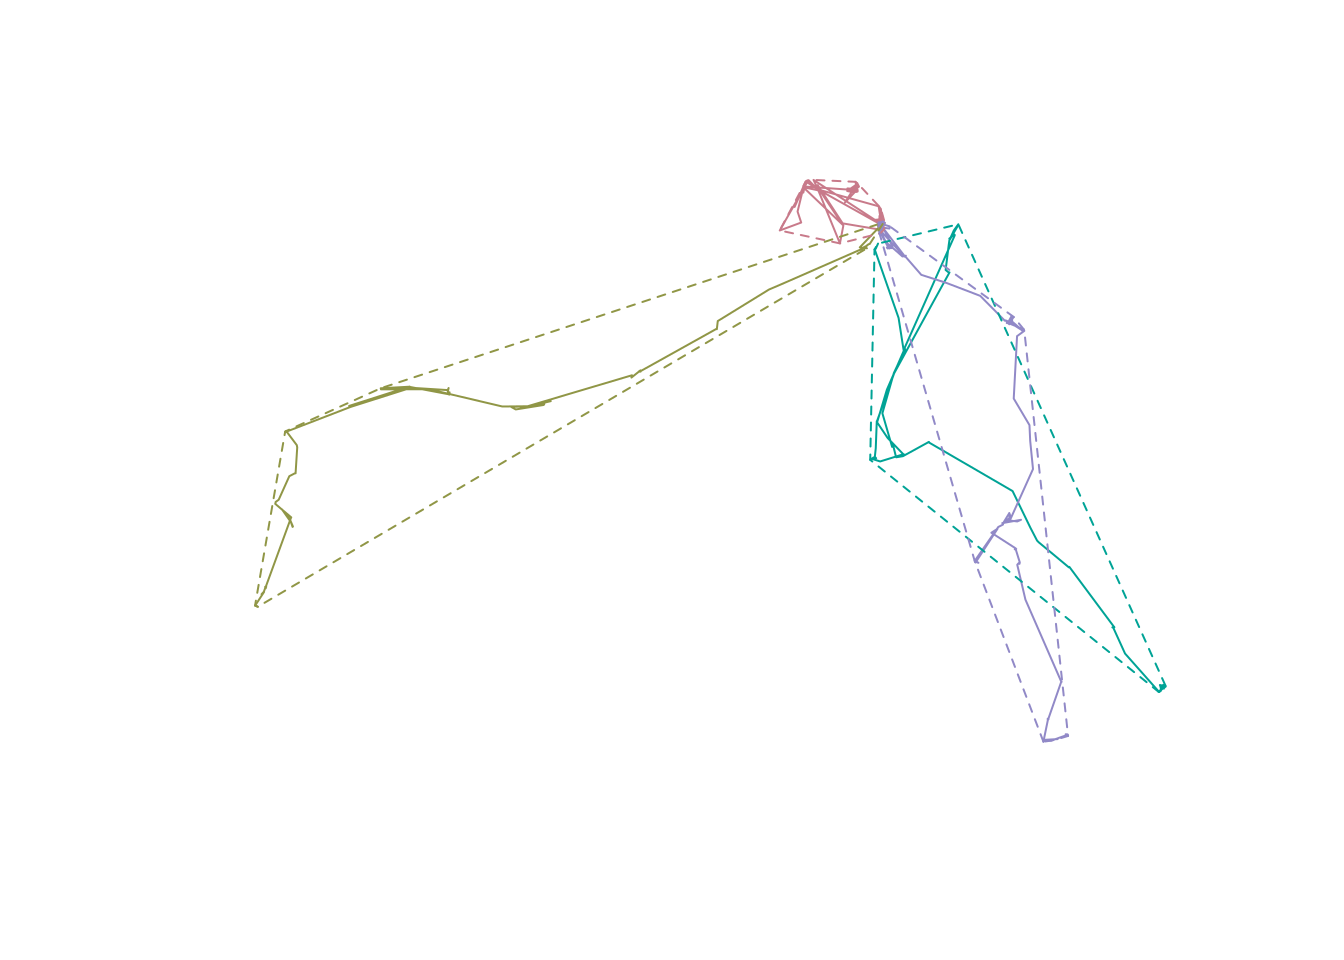
Figure H.2: Trajectories and convex hull polygons of four elks
(50 points)